
- Title
-
Zebrafish Model as a Screen to Prevent Cyst Inflation in Autosomal Dominant Polycystic Kidney Disease
- Authors
- Oliveira, I., Jacinto, R., Pestana, S., Nolasco, F., Calado, J., Lopes, S.S., Roxo-Rosa, M.
- Source
- Full text @ Int. J. Mol. Sci.
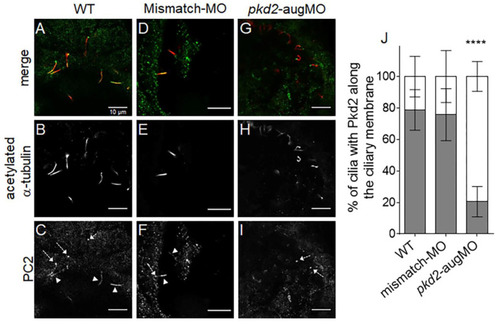
PC2 staining along the KV cilia from 10 ss embryos. (A–I) Confocal images showing immunolocalization of PC2 in KV cells at the 10–11 ss in WT (A–C), mismatch-MO (D–F), and PC2-knockown (pkd2-augMO) (G–I) embryos. White arrowheads indicate PC2 detected along cilia and dashed arrows indicate PC2 at the cilia basal body. (J) Quantification of the percentage of cilia having PC2 signal along their membrane (gray bars) versus those with no PC2 staining along their membrane (white bars) in WT (n = 16), mismatch-MO (n = 8), and PC2-knockown (n = 8) embryos, immunodetected for acetylated α-tubulin. All samples followed a normal distribution and presented equal variances. Differences were, thus, statistically tested by t-test, **** p < 0.0001. Scale bars: 10 μm. EXPRESSION / LABELING:
PHENOTYPE:
|
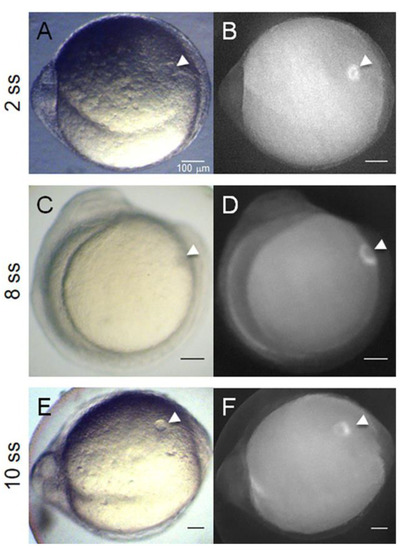
The zebrafish KV—a model organ to study cyst inflation. The KV localized at the tail region of a 2–14 ss zebrafish embryo. TgBAC(cftr-GFP)pd1041 zebrafish line characterization. (A,C,E) are bright field captured images. (B,D,F) were acquired by fluorescence stereomicroscopy. White arrowheads indicate the KV. Scale bars: 100 μm. EXPRESSION / LABELING:
|

Estimated CFTR-GFP protein level in KVs of TgBAC(cftr-GFP)pd1041 embryos. (A–L) Confocal live-scan analysis. The middle plan along the xy axis and its respective orthogonal views (along xz and yz axes) and the image resulting from the sum of all slices of the confocal live-microscopy scan of the whole KV are, respectively, shown for the most representative non-injected control (A,D), mismatch-MO (B,E), and pkd2-knockdown (C,F) embryos. (G–I) The apical region of the KV cells of (D,E,F) is highlighted in red. (J–L) anterior (upper) versus posterior (lower) parts of the KV are highlighted. (M) MFI determined for the whole KV, KV cells’ apical region and KV’s anterior versus posterior regions of non-injected control (n = 15), mismatch-MO (n = 6), and pkd2-knockdown (n = 20) embryos. Median averages ± SD are indicated. t-test was used to compare whole KV MFIs of pkd2-augMO versus non-injected embryos (samples with normal distribution and equal variances), ** p < 0.01. Mann–Whitney test was used to compare the MFIs of KV cells’ apical region of pkd2-augMO versus non-injected embryos (samples that did not passed normality tests), * p < 0.05. Paired t-test was used to compare the anterior versus posterior MFIs for each situation (all samples having normal distribution), ψ p < 0.05. Scale bars: 10 μm. EXPRESSION / LABELING:
PHENOTYPE:
|
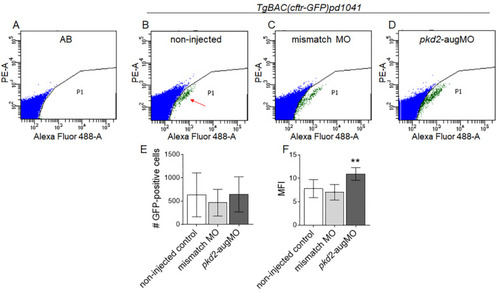
Flow cytometry analysis of the CFTR-GFP protein level in TgBAC(cftr-GFP)pd1041 embryos. Flow cytometry plots representative of AB control (A) and non-injected TgBAC(cftr-GFP)pd1041 8–10 ss (B) embryos, for the established limiting gates. Red arrow indicates the GFP-positive cell population. (C,D) Flow cytometry plots representative of the GFP-positive cells of mismatch-MO (C) and pkd2-augMO (D) embryos. (E) Number of analyzed GFP-positive cells of non-injected controls (11 replicates), mismatch-MO (3 replicates), and pkd2-knockdown embryos (5 replicates). Each replicate had about 200 embryos. (F) MFI determined for GFP-positive cells of non-injected controls, mismatch-MO, and pkd2-knockdown embryos. Median averages ± SD are indicated. As the pkd2-augMO injected embryos sample did not follow a normal distribution, the Mann–Whitney test was used to compare pkd2-augMO versus non-injected embryos MFIs, ** p < 0.01. EXPRESSION / LABELING:
PHENOTYPE:
|
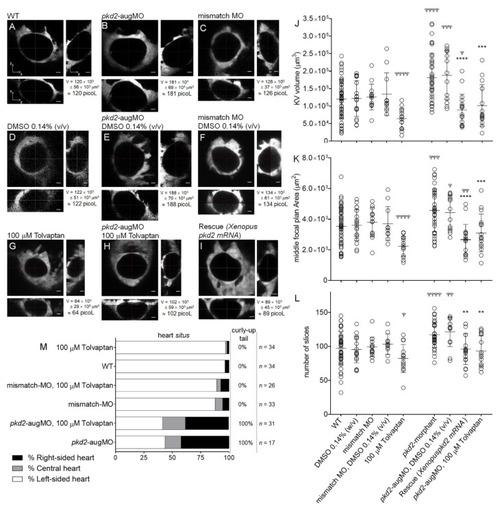
KV volume, a live readout of the CFTR activity. (A–I) Confocal live-microscopy scans of whole KVs from sox17:GFP transgenic embryos, at 10–11 ss. The middle focal plane along the xy axis and its respective orthogonal views (along xz and yz axes) are shown for the most representative embryos: WT (A), pkd2-knockdown (B), mismatch MO (C), WT + 0.14% (v/v) DMSO (D), pkd2-knockdown + 0.14% (v/v) DMSO (E), mismatch MO + 0.14% (v/v) DMSO (F), WT + 100 μM tolvaptan (G), pkd2-knockdown + 100 μM tolvaptan (H), and rescue (pkd2-knockdown + Xenopus pkd2-mRNA) (I). KV volume is indicated in μm3 and in picoliters. Scale bars: 10 μm. (J,K,L) Estimated KV volumes (μm3), middle focal plan area (μm2) and number of slices of the z-stacks for WT (n = 51), WT treated with 0.14% (v/v) DMSO (n = 19), mismatch-MO (n = 14), mismatch MO + 0.14% (v/v) DMSO (n = 11), 100 μM tolvaptan (n = 14), pkd2-knockdown (n = 38), pkd2-knockdown treated with 0.14% (v/v) DMSO (n = 13), 100 μM tolvaptan (n = 16), and rescue (pkd2-knockdown + Xenopus pkd2-mRNA) (n = 18). Mean ± S.D. All samples, except mismatch MO + 0.14% (v/v) DMSO volume and middle focal plan area, pkd2-knockdown + 100 μM tolvaptan volume, pkd2-knockdown number of slices, and pkd2-knockdown + 0.14% (v/v) DMSO number of slices, had a normal distribution. The comparisons of samples that did not have normal distribution with respective WT and pkd2-knockdown samples were analyzed with the Mann–Whitney test. t-test with the Welch correction was used to compare WT + 100 μM tolvaptan with WT volume and middle focal plan area (samples with unequal variances). All other comparisons to WT and to pkd2-knockdown samples were made using the t-test. ψ p < 0.05, ψψ p < 0.01, ψψψ p < 0.001, and ψψψψ p < 0.0001, significantly different from WT; and **** p < 0.0001, *** p < 0.001, and ** p < 0.01, significantly different from pkd2-knockdown embryos. (M) Heart position defects and curly-up tail phenotype of WT and mismatch-MO controls and PC2 knockdown embryos, treated with 100 μM tolvaptan. n, number of scored embryos. EXPRESSION / LABELING:
PHENOTYPE:
|
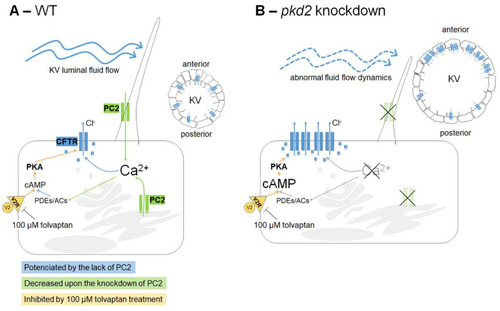
Working model of the cross-talk between PC2 and CFTR in the KV inflation. (A) As in kidney cysts, we extrapolate that in WT KV epithelial cells, once stimulated by the luminal fluid-flow, PC2 raises intracellular Ca2+ transients. These should maintain the basal intracellular levels of cAMP, through regulation of Ca2+-dependent adenylyl cyclases (ACs) and phosphodiesterases (PDEs). cAMP is required for the normal rate of CFTR activity. This ensures the CFTR-mediated transport of Cl− and subsequent movement of water into the KV lumen, allowing its inflation. Additionally, cAMP levels are also dependent on V2R since we know that its pharmacological inhibition by 100 µM tolvaptan impairs the KV inflation. (B) The knockdown of pkd2 changes several variables of the KV: volume enlargement [27], different cell shapes [27] and, therefore, different architectures with the consequent loss of the anterior cilia cluster [27,34], shorter cilia [34], and weakened and homogeneous luminal flow [34]. The lack of PC2 should lower the intracellular levels of Ca2+, which, through still unknown mechanisms, leads to a significant increase of CFTR expression at the apical region of the cell (membrane and subapical zone), namely in the anterior part of the KV. This justifies the CFTR-mediated KV enlargement observed upon lack of PC2. It is still unknown if the resulting raise in the cAMP levels, induced by the low Ca2+ levels, further potentiates the CFTR activity. However, mimicking a kidney cyst, pharmacological inhibition of KV V2R by 100 µM tolvaptan was enough to rescue the KV enlargement of these embryos. |