
- Title
-
TCMacro: A Simple and Robust ImageJ-Based Method for Automated Measurement of Tail Coiling Activity in Zebrafish
- Authors
- Kurnia, K.A., Santoso, F., Sampurna, B.P., Audira, G., Huang, J.C., Chen, K.H., Hsiao, C.D.
- Source
- Full text @ Biomolecules

Plotline workflow of TCMacro for zebrafish embryo tail coiling measurement. The process starts with video recording (A), automatic ROI Selection (B), data collection using Plot Z-axis profile and BAR Plugin (C) and the collected data was saved as Excel file (.xlsx) for data processing in excel (D). |

Optimization of Hough Circle Transformation for object circularity detection. Hough Circle Transform result according to (A) Zhang et al., 2019 method or (B) our proposed TCMacro method (Hough Score Threshold = 0.5). (C) Hough Score Threshold value fine-tuning to acquire the best automatic ROI selection result. Recorded at 12× magnification. Eggs be correctly selected were labeled with yellow circles. |
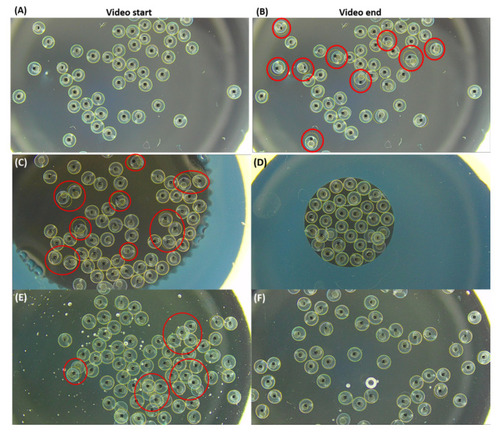
Comparison of different methods to reduce embryo position shifting during video recording for tail coiling measurement in zebrafish. (A) ROI selection in dissecting microscopy with darkfield setting. (B) Some embryos’ position was shifted due to embryo tail coiling (labeled by red circles). Two different sizes of agarose holders were tested to reduce the inter-embryo space with either (C) agarose outer wall (ø = 8.5 mm) or (D) agarose outer wall (ø = 4.4 mm). Two different concentrations of methylcellulose at either (E) 1% or (F) 0.5% were used to increase the mounting medium viscosity to prevent embryo position shifting. Egg movement caused by tail coiling occurrence was detected and marked with red circles. Images were captured at a low magnification at 6×. |

Tail coiling activity plot over time for zebrafish embryo tail coiling activity measurement. The x-axis represents time (frame), while the y-axis represents signal intensity. Raw tail coiling activity plot obtained from Plot Z-axis Profile tool (A) and peaks extracted at 0.95 minimal amplitude and different peak distance of 10 (B) and 30 (C), x-axis = video frames, y-axis = intensity. |
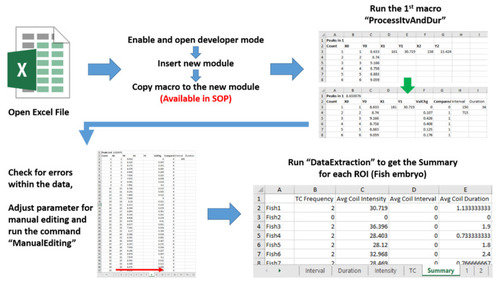
Workflow of tail coiling data collection automation step using Microsoft Excel VBA (Visual Basic for Applications). Three important macro scripts of ProcessitvAndDur, ManualEditing and DataExtraction were developed to boost data calculation automation. |

Start and end threshold set for tail coiling occurrence duration and the interval between tail coiling occurrence. Some important endpoints such as tail coiling interval and tail coiling duration can also be extracted from the raw signal intensity over time data. |
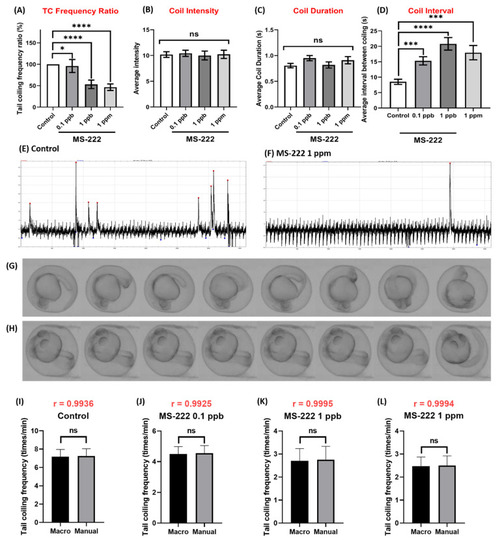
Comparison of tail coiling activity for zebrafish embryos at 24 hpf for control and MS-222 exposure. (A) Quantitative comparison of tail coiling frequency ratio, (B) average intensity, (C) coil duration and (D) coil interval of zebrafish embryos treated with different doses of MS-222. The representative tail coiling peak obtained from either (E) control or (F) 1 ppm MS-222 exposed zebrafish. Time-lapse comparison showing tail coiling movement in zebrafish embryo after receiving either (G) 0 or (H) 1 ppm MS-222. Statistical validation is carried out using Kruskal-Wallis test. Data are presented as Mean ± SEM, n = 40. (I–L) Statistic comparison of data collected by either TCMacro or manual counting for either (I) control, (J) MS-222 0.1 ppb, (K) MS-222 1 ppb or (L) MS-222 10 ppb treated embryos. The statistical difference is double validated using Pearson correlation (black color) and Wilcoxon test (red color). Data are presented as Mean ± SEM, n = 40 (* p < 0.05, *** p < 0.001, **** p < 0.0001, ns p > 0.05). |

Comparison of tail coiling activity for zebrafish embryos at 24 hpf for control and caffeine exposure. (A) Quantitative comparison of tail coiling frequency ratio, (B) average intensity, (C) coil duration and (D) coil interval of zebrafish embryos treated with different doses of caffeine. The representative tail coiling peak obtained from either (E) control or (F) 300 ppm caffeine exposed zebrafish. Time-lapse comparison showing tail coiling movement in zebrafish embryo after receiving either (G) 0 or (H) 300 ppm caffeine. Statistical validation is carried out using Kruskal-Wallis test. Data are presented as Mean ± SEM, n = 40 (* p < 0.05, ** p < 0.01, *** p < 0.001, **** p < 0.0001, ns p > 0.05). |