
Image
|
Figure Caption
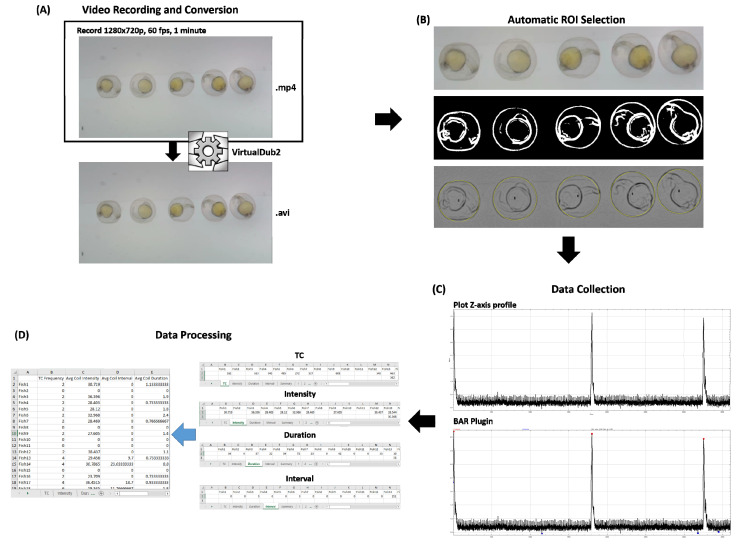
Figure 1
Plotline workflow of TCMacro for zebrafish embryo tail coiling measurement. The process starts with video recording (A), automatic ROI Selection (B), data collection using Plot Z-axis profile and BAR Plugin (C) and the collected data was saved as Excel file (.xlsx) for data processing in excel (D).
Acknowledgments
This image is the copyrighted work of the attributed author or publisher, and
ZFIN has permission only to display this image to its users.
Additional permissions should be obtained from the applicable author or publisher of the image.
Full text @ Biomolecules