FIGURE SUMMARY
Title

Sodium valproate increases activity of the sirtuin pathway resulting in beneficial effects for spinocerebellar ataxia-3 in vivo

Authors
Watchon, M., Luu, L., Robinson, K.J., Yuan, K.C., De Luca, A., Suddull, H.J., Tym, M.C., Guillemin, G.J., Cole, N.J., Nicholson, G.A., Chung, R.S., Lee, A., Laird, A.S.
Source
Full text @ Mol. Brain

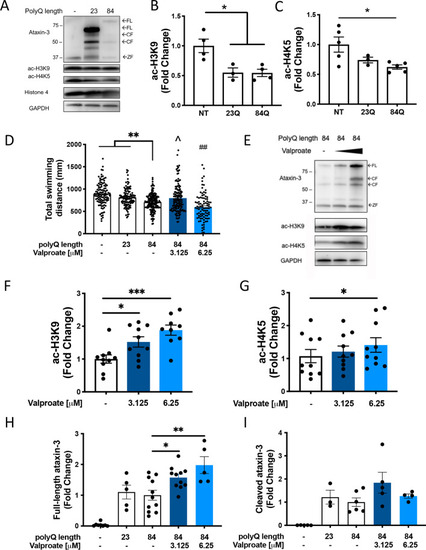
Levels of acetylated histones 3 and 4 are decreased in MJD zebrafish and sodium valproate increases levels of acetylated histones and locomotion in transgenic MJD zebrafish. A Immunoblots of 6-day-old transgenic MJD zebrafish expressed human ataxin-3 with full-length (FL) ataxin-3, cleaved (CF) ataxin-3 and endogenous zebrafish ataxin-3 (ZF). Transgenic MJD zebrafish also have decreased levels of acetylated histone 3 (ac-H3K9) and 4 (ac-H4K5) with no differences in histone 4. B Quantification of ac-H3K9 showed wild-type and mutant ataxin-3 larvae with significantly lower levels of ac-H3K9 compared to the non-transgenic control (*p < 0.022, n = 3–5). C Densitometric analysis of the amount of ac-H4K5 revealed a significant decrease in ac-H4K5 in the mutant ataxin-3 zebrafish compared to the non-transgenic control (*p = 0.026, n = 3–5). D Treatment of MJD zebrafish with low-dose sodium valproate (valproate; 3.125 µM) increased the distance travelled during movement tracking to control treated EGFP-Ataxin-3 84Q (^p = 0.019, n = 93–161). By contrast, high dose valproate (6.25 µM) decreased the distance travelled compared to EGFP-Ataxin-3 84Q, ##; p = 0.008. E Western blotting of valproate treated EGFP-Ataxin-3 84Q larvae resulted in increased levels of full-length human ataxin-3, ac-H4K5 and ac-H3K9. F Quantification of ac-H3K9 levels revealed valproate treatment increased ac-H3K9 in a dose dependent manner (*p = 0.004 and ***p = 0.003; n = 9). G Quantification of ac-H4K5 showed an increase with 6.25 µM valproate treatment (*p = 0.043, n = 10). H Quantification of human FL ataxin-3 showed significantly increased levels with both concentrations of valproate treatment compared to vehicle treated mutant ataxin-3 fish (*p = 0.0495, **p = 0.002, n = 5–11). I Quantification of human CF ataxin-3 relative to loading control showed no changes after treatment with sodium valproate (n = 3–6). Data represent mean ± SEM. Statistical analysis used in this figure were paired and unpaired one-way ANOVA with Tukey post-hoc analysis

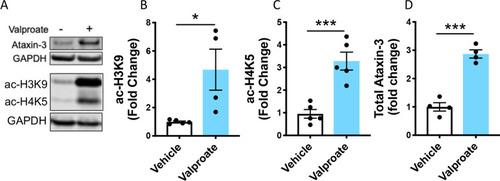
Sodium valproate treatment increased acetylated histones in HEK293 cells expressing human ataxin-3. A HEK293 cells expressing human ataxin-3 were treated with either sodium valproate (Valproate) or vehicle and protein lysates extracted from groups of larvae underwent immunoblot analysis for acetylated histones 3 and 4 and human ataxin-3. Quantification revealed that valproate treatment increased the amount of B acetylated histone 3 (ac-H3K9); C acetylated histone 4 (ac-H4K5); and D expressed human ataxin-3, compared to vehicle control treatment (*p = 0.023, ***p = 0.0007, ***p = 0.0001 respectively; n = 4–5 independent experiments). Data represents mean ± SEM and statistical analyses used were unpaired student t-tests

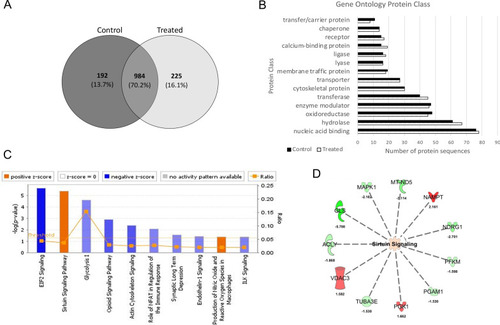
Label-free quantitative proteomics of EGFP-Ataxin-3 84Q transgenic zebrafish treated with vehicle and sodium valproate. A Triplicate analyses of vehicle and valproate treated transgenic zebrafish identified common and unique proteins. B Gene ontology (GO) annotation revealed small differences in the identification of proteins, with more proteins (9%) with hydrolase function, while less proteins (3%) were categorized to have carrier activity. C Ingenuity Pathway Analysis (IPA) predicted activation and inhibition of sirtuin signaling and EIF2 signaling pathways respectively upon valproate treatment of transgenic zebrafish expressing EGFP-Ataxin-3 84Q. Blue indicates IPA predicted inhibition and orange indicates predicted activation of categorised biological function and canonical pathways. D Predicted upregulation and downregulation of proteins associated with the sirtuin signaling pathway. Green indicates downregulation (0.67-fold) and red indicates upregulation (1.5-fold) of proteins in valproate treated EGFP-Ataxin-3 84Q zebrafish compared to the vehicle controls

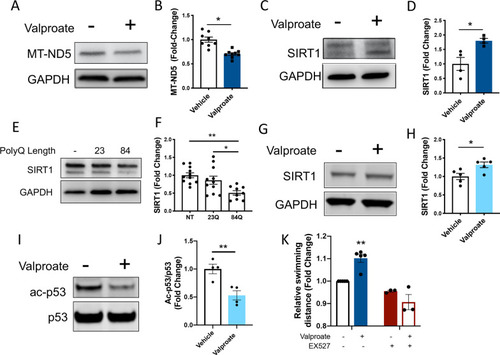
Sodium valproate treatment increases SIRT1 levels and signs of sirtuin activity, validating the increased sirtuin activity predicted by mass spectrometry. A Valproate treatment predicted decreased MTND5 levels from the proteomic analysis. Immunoblot of MTND5 showed valproate treated EGFP-ataxin-3 84Q protein lysates at 6dpf were decreased. B Quantification of MTND5 levels confirmed this finding (*p < 0.001, n = 8–9). C Immunoblots of mutant ataxin-3 zebrafish treated with valproate showed an increase in SIRT1 expression. D Quantification of SIRT1 levels revealed an increase with valproate treatment (*p = 0.015, n = 4). E Immunoblots of 6-day old transgenic MJD zebrafish show levels of SIRT1. F Densitometric analysis revealed decreased levels of SIRT1 in zebrafish expressing ataxin-3 with polyQ expansion compared to wild-type ataxin-3 and non-transgenic fish (p = 0.025 and p = 0.002 respectively, n = 9–11). G Immunoblot analysis of ataxin-3 84Q expressing HEK293 cells treated with valproate revealed that valproate increases SIRT1. H Quantification SIRT1 levels revealed a significant increase in SIRT1 from valproate treatment (p = 0.024, n = 5). I Immunoblot of acetylated p53 and p53, as p53 deacetylation is a marker of sirtuin activity from ataxin-3 84Q expressing HEK293 cells treated with and without valproate. J Quantification of acetylated p53 levels, normalized to p53 levels, revealed that valproate treatment resulted in increased p53 deacetylation (p = 0.008, n = 4). K Whilst treating the EGFP-ataxin-3 84Q zebrafish with valproate resulted in the zebrafish swimming longer distances, co-treatment with valproate and EX527, or EX527 alone (SIRT1 inhibitor), did not result in increased swimming distances (p < 0.002; valproate group significantly greater distances swum than all other groups). Data represents mean ± SEM. All cell culture experiments are of independent experiments. Comparisons between vehicle and valproate treatment were analysed statistically using unpaired student t-tests, comparison between ATXN3 genotypes were analysed using an unpaired one-way ANOVA followed by a Tukey post-hoc analysis and comparison of valproate versus EX527 treated was analysed using a two-way ANOVA followed by Tukey post-hoc analysis

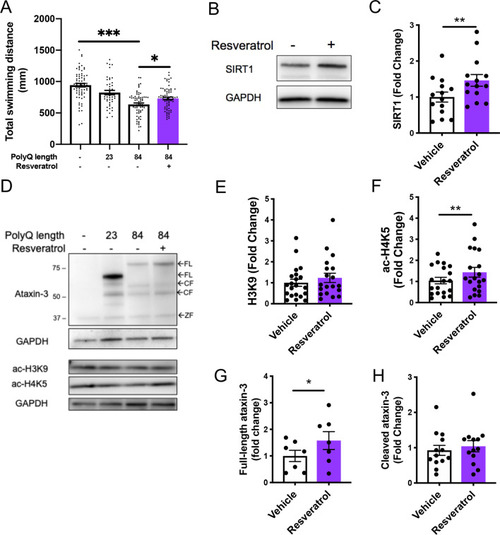
Resveratrol treatment alleviates motor dysfunction whilst simultaneously increasing acetylated histone and SIRT1 levels. A Mutant ataxin-3 zebrafish at 6 days post fertilization (dpf) showed a decrease in the distance swum (***p < 0.001) whilst resveratrol treatment (50 µM) from 1–6 dpf rescued this dysfunction, (*p = 0.0033, n = 45–71). B Immunoblot of vehicle versus resveratrol treated EGFP-Ataxin-3 84Q fish at 6 dpf showed increased SIRT1 levels following resveratrol treatment. C Quantification revealed that SIRT1 levels were increased by resveratrol (p = 0.003, n = 14). D Immunoblot of 6 dpf transgenic MJD zebrafish treated with or without resveratrol increases full-length (FL) human ataxin-3 levels. E Quantification of levels of acetylated H3K9 (ac-H3K9); F acetylated H4K5 (ac-H4K5); G FL ataxin-3; and H cleaved (CF) ataxin-3, revealed that resveratrol treatment produced no change in ac-H3K9 levels, an increase in ac-H4K5 (**p = 0.005), an increase in FL-ataxin-3 (*p = 0.018) and no change in cleaved ataxin-3 levels (n = 19, n = 19, n = 7 and n = 7 respectively). CF cleavage fragment, ZF zebrafish. Data represents mean ± SEM. Statistical analysis used for motor behaviour tracking was a one-way ANOVA followed by a Tukey post-hoc analysis and the immunoblot comparisons were analysed using a paired student t-test

Treatment with sodium valproate (valproate) induces activity of the autophagy pathway in transgenic MJD zebrafish and human ataxin-3 expressing HEK293 cells. A Immunoblots of 6 dpf EGFP-Ataxin-3 84Q zebrafish treated with either valproate or vehicle control were probed with several markers of the autophagy pathway. Quantification of B beclin-1, C p62 and D LC3-II each revealed a significant increase with valproate treatment (*p = 0.014, p = 0.029 and p = 0.026 respectively, n = 3–6). E) Valproate treatment of HEK293 cells expressing Ataxin-3 84Q resulted in similar p62 levels, but increased LC3II levels. Quantification of these substrates revealed F p62 was not significantly different between valproate and vehicle treatment (p = 0.518) whilst G LC3II levels were significantly different for valproate compared to vehicle treated (p = 0.031, n = 4). Comparisons between vehicle and valproate treatment were compared using unpaired student t-tests

Induction of autophagy following sodium valproate (valproate) treatment of MJD zebrafish and human ataxin-3 expressing HEK293 cells is dependent on sirtuin activity. A Protein lysates from groups of MJD zebrafish larvae underwent immunblotting for LC3B. B Densiometric analysis revealed that valproate treatment increased LC3II/I ratio compared to vehicle treatment (**p = 0.003), but co-treatment with valproate and EX527 prevented this increase in LC3II/I (*p = 0.013, n = 6–7). C Immunoblots for LC3 were performed on lysates from cells treated with valproate, EX527 and 3MA, together and alone. D Densiometric analysis revealed that whilst valproate increased LC3II/I ratio, suggesting increased autophagosome production, cotreatment with valproate and EX527 or valproate and 3MA prevented that increase (*p < 0.05, n = 3 independent experiments). Data represents mean SEM. Comparisons were made using two-way ANOVAs followed by a Tukey post-hoc analysis

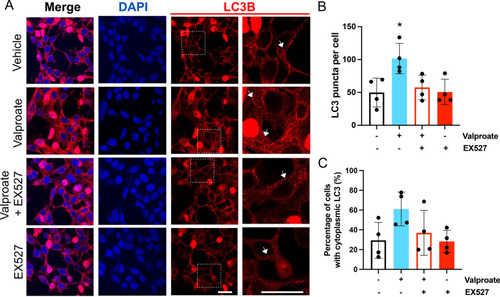
Treatment with sodium valproate (valproate) results in an increase in LC3 within HEK 293 cells expressing ataxin-3 84Q. A HEK 293 cells expressing human ataxin-3 84Q were treated with vehicle, sodium valproate (valproate), valproate and EX527 or EX527 alone, and afterwards stained for LC3 (red) and nuclei (DAPI, blue). Those treated with valproate showed strong LC3 (red) staining. Enlarged inset images of the LC3 staining make the LC3 puncta (examples marked with arrows) easier to see. B Automated counting of LC3 (red) puncta revealed that valproate treatment increased the presence of LC3 puncta, whilst EX527 cotreatment and EX527 alone had similar numbers of puncta to the vehicle control treated group (*p < 0.0483, valproate compared to all other groups). C Manual counting of cells with cytoplasmic LC3 (red) staining revealed that valproate had not produced a significant cytoplasmic shift of LC3. Comparisons were analysed using a one-way ANOVA followed by a Tukey post-hoc analysis. Scale bars represent 20 μm

Acknowledgments
This image is the copyrighted work of the attributed author or publisher, and ZFIN has permission only to display this image to its users. Additional permissions should be obtained from the applicable author or publisher of the image. Full text @ Mol. Brain