IMAGE

Fig. 8

ID
ZDB-IMAGE-210825-12
Source
Figures for Watchon et al., 2021
Image
Figure Caption

Fig. 8

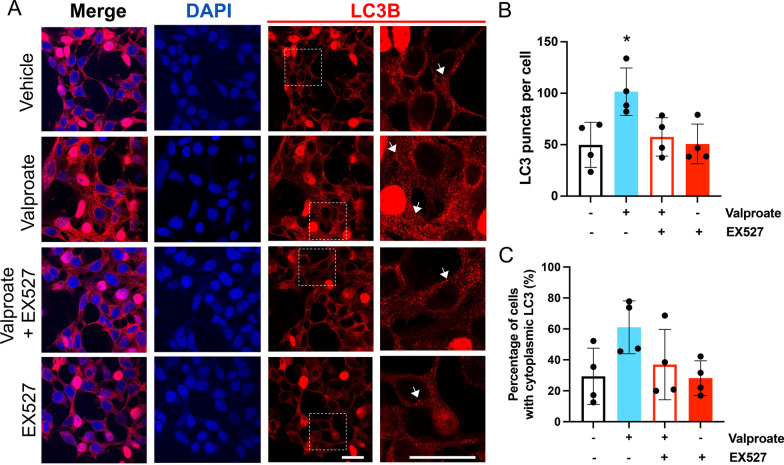
Treatment with sodium valproate (valproate) results in an increase in LC3 within HEK 293 cells expressing ataxin-3 84Q. A HEK 293 cells expressing human ataxin-3 84Q were treated with vehicle, sodium valproate (valproate), valproate and EX527 or EX527 alone, and afterwards stained for LC3 (red) and nuclei (DAPI, blue). Those treated with valproate showed strong LC3 (red) staining. Enlarged inset images of the LC3 staining make the LC3 puncta (examples marked with arrows) easier to see. B Automated counting of LC3 (red) puncta revealed that valproate treatment increased the presence of LC3 puncta, whilst EX527 cotreatment and EX527 alone had similar numbers of puncta to the vehicle control treated group (*p < 0.0483, valproate compared to all other groups). C Manual counting of cells with cytoplasmic LC3 (red) staining revealed that valproate had not produced a significant cytoplasmic shift of LC3. Comparisons were analysed using a one-way ANOVA followed by a Tukey post-hoc analysis. Scale bars represent 20 μm

Acknowledgments
This image is the copyrighted work of the attributed author or publisher, and ZFIN has permission only to display this image to its users. Additional permissions should be obtained from the applicable author or publisher of the image. Full text @ Mol. Brain