
- Title
-
Modelling neurodevelopmental disorders and epilepsy caused by loss of function of kif2a in zebrafish
- Authors
- Partoens, M., De Meulemeester, A.S., Giong, H.K., Pham, D.H., Lee, J.S., de Witte, P.A., Siekierska, A.
- Source
- Full text @ eNeuro

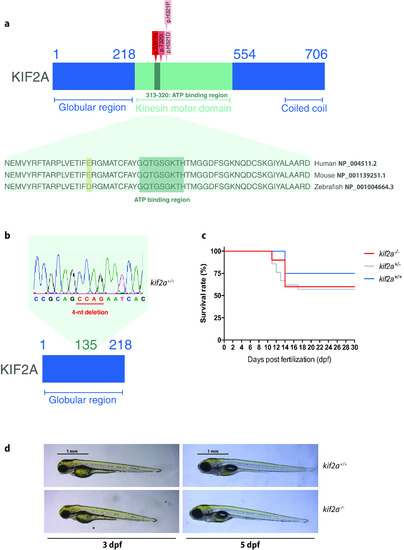
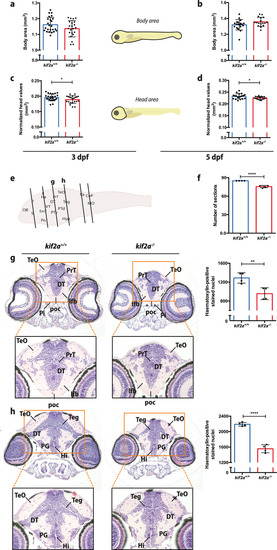
ZFIN is incorporating published figure images and captions as part of an ongoing project. Figures from some publications have not yet been curated, or are not available for display because of copyright restrictions. |
|
ZFIN is incorporating published figure images and captions as part of an ongoing project. Figures from some publications have not yet been curated, or are not available for display because of copyright restrictions. |
|
ZFIN is incorporating published figure images and captions as part of an ongoing project. Figures from some publications have not yet been curated, or are not available for display because of copyright restrictions. PHENOTYPE:
|
|
ZFIN is incorporating published figure images and captions as part of an ongoing project. Figures from some publications have not yet been curated, or are not available for display because of copyright restrictions. PHENOTYPE:
|
A novel PHENOTYPE:
|
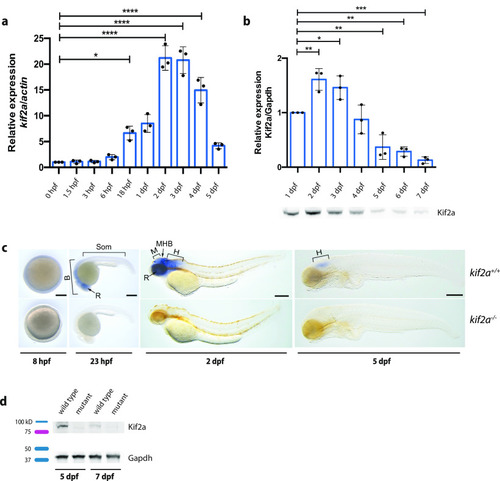
Expression and localization pattern of PHENOTYPE:
|
|
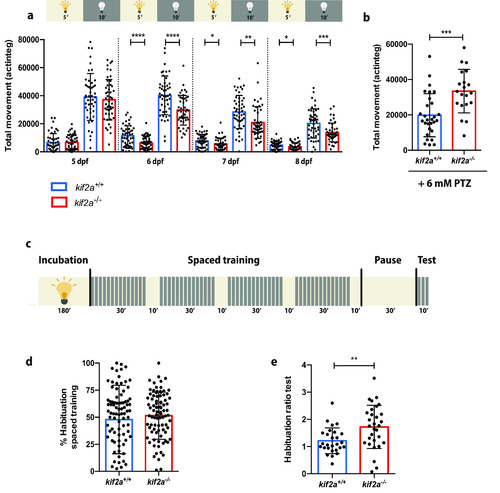
PHENOTYPE:
|
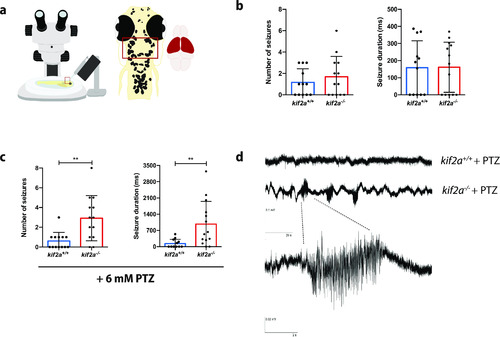
PHENOTYPE:
|

Neuronal cell proliferation defects and increased apoptosis in |
|
Unillustrated author statements PHENOTYPE:
|