
- Title
-
Zebrafish Cdx4 regulates neural crest cell specification and migratory behaviors in the posterior body
- Authors
- Rocha, M., Kushkowski, E., Schnirman, R., Booth, C., Singh, N., Beadell, A., Prince, V.E.
- Source
- Full text @ Dev. Biol.
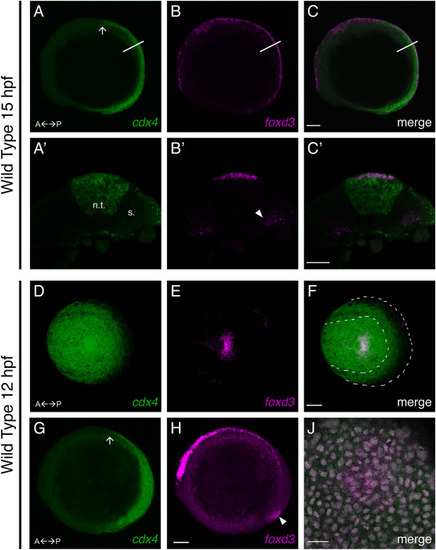
Zebrafish cdx4 is expressed in NC cells. A-C. Lateral views of a 15 hpf embryo; A’-C’ are views of a single 5 μM optical section of a hand-cut transverse section from the trunk. A. cdx4 mRNA detected in the tailbud and spinal cord by HCR. The anterior limit of expression corresponds to the hindbrain/spinal cord boundary (arrow). A’. cdx4 expression in a 5 μM optical section from the trunk (line in A); n.t. indicates the neural tube, s. indicates the somite. B. foxd3 mRNA detected in NC cells along the AP axis, the posterior somites, and the tailbud. B’. foxd3 expression in the 5 μm optical section (line in B); arrowhead indicates foxd3 expression in the somitic mesoderm. C. co-detection of cdx4 and foxd3 at the dorsal neural tube, scale bar = 100 μm. C’. cdx4 and foxd3 co-expression in the premigratory trunk NC cells in the 5 μm optical section (line in C); scale bar = 25 μm. D-F. Dorsal view of the tailbud of a 12 hpf embryo. D. cdx4 mRNA transcripts in the tailbud detected by HCR. E. foxd3 mRNA transcripts in the tailbud detected by HCR. F. Merged image of A and B reveals co-expression of cdx4 and foxd3 transcripts at the tailbud. Dashed lines demarcate the outline of the neural plate border (inner line) and the yolk; scale bar = 100 μm. G, H. Lateral views of a 12 hpf embryo, scale bar = 100 μm; G cdx4 mRNA detected in the tailbud and spinal cord by HCR. The anterior limit of expression is indicated (arrow). H. foxd3 mRNA detected in NC cells along the entire AP axis and in the tailbud (arrowhead) by HCR. I. Dorsal view (as indicated by arrowhead in H) of a high magnification (40x objective) 0.75 μm single optical section of the tailbud of a 12 hpf embryo, colabeled with DAPI (grey), showing that cdx4 and foxd3 transcripts colocalize to single cells, scale bar = 25 μm. EXPRESSION / LABELING:
|
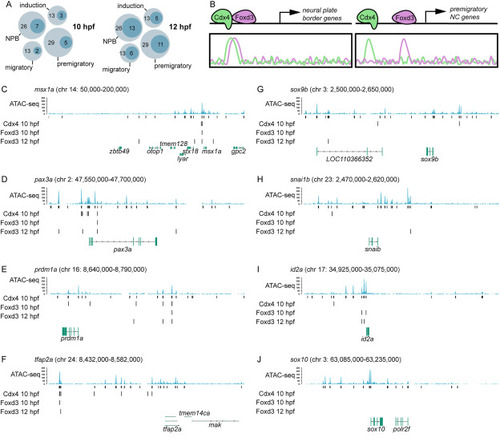
Cdx4 and FoxD3 bind near early NC cell specification genes. A. Schematic representation showing number of genes of each zebrafish NC GRN module bound by both Cdx4 at 10 hpf and Foxd3 (dark circle) at 10 and 12 hpf out of the total number of genes in the module (light circle). B. Schematic representation of Cdx4 and Foxd3 binding near genes of the NPB module (left) and premigratory module (right). C–F. Analysis of Cdx4 and Foxd3 binding near the NPB genes msx1a (C), pax3a (D), prdm1a (E), and tfap2a (F), as well as the premigratory and migratory NC genes sox9b (G), snai1b (H), id2a (I), and sox10 (J). In all panels, the plots are laid out as follows (from top to bottom): ATAC-seq profiles from foxd3-expressing cells, with called peaks below, Cdx4-Myc ChIP-seq peaks at 10 hpf, Foxd3-biotin-ChIP-seq peaks at 10 hpf, and 12 hpf, and Ref-seq annotated genes. PHENOTYPE:
|
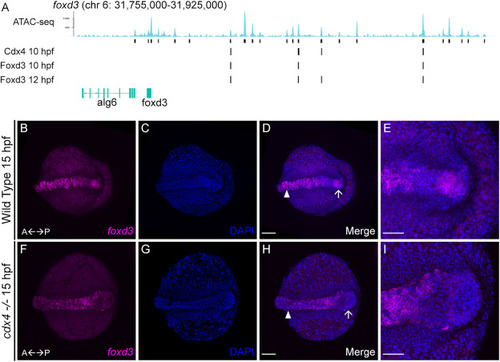
Cdx4 regulates posterior expression of foxd3. A. Analysis of Cdx4 and Foxd3 binding near the foxd3 locus. B-E. Dorsal view of 15 hpf WT or cdx4ch107+/− heterozygous embryo shows foxd3 RNA transcripts detected by HCR in the dorsal spinal cord and tailbud (B) counterstained with DAPI (C). D. Merged image of B and C; arrow indicates tailbud, arrowhead labels neural tube. Scale bar = 100 μm. E. Magnified view of tailbud region from D; scale bar = 50 μm. F–I. Dorsal view of 15 hpf cdx4ch107−/- mutant embryo shows foxd3 RNA transcripts detected by HCR in the dorsal spinal cord and lack of expression in the tailbud (F) counterstained with DAPI (G). H. Merged image of F and G; arrow indicates tailbud, arrowhead labels neural tube. Scale bar = 100 μm. I. Magnified view of tailbud region from H; scale bar = 50 μm. EXPRESSION / LABELING:
PHENOTYPE:
|
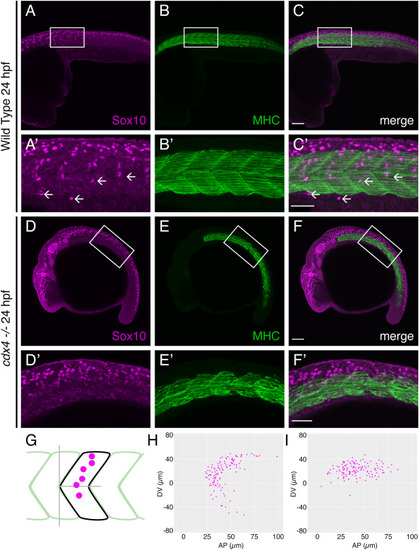
cdx4 mutants show impaired segmental migration of trunk NC cells. A-C. Lateral view of 24 hpf WT embryo labeled with anti-Sox10 (A, NC cells, magenta) and anti-Myosin Heavy Chain (B, somites, green) antibodies reveal segmental migration pathways of trunk NC cells, scale bar = 100 μm. A’-C’. High magnification images of boxed area from A-C (arrows = individual segmental chains), scale bar = 50 μm. D-F. Lateral view of 24 hpf cdx4ch107−/- embryo labeled with anti-Sox10 (D, NC cells, magenta) and anti-Myosin Heavy Chain (E, somites, green) antibodies reveal defects in trunk NC cell migration. Scale bar = 100 μm. D’-F’. High magnification images of boxed area from D-F, scale bar = 50 μm. G. Schematic representing approach for mapping the position of trunk NC cells relative to the adjacent somite; analysis was performed at the level of somites 5–10. H, I. Plots of migrating trunk NC cells relative to the adjacent somite in WT embryos (H) and cdx4ch107−/- embryos (I). Data from 18 total segments were superimposed on each plot. |
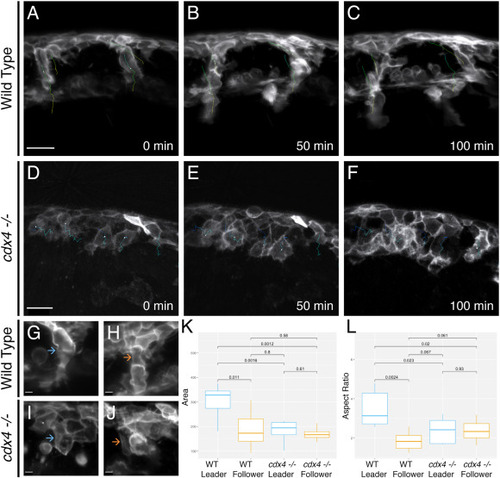
cdx4 mutants exhibit aberrant cell behaviors during migration. A-J. Timelapse microscopy of trunk NC cell migration in Tg(sox10:mRFP) embryos visualized by SPIM reveals cellular behaviors. A-C. In WT embryos, NC cells migrate as single-cell segmental chains. Tracking of leader and follower cells during migration shows that leader cells are not overtaken. Scale bar = 25 μm. D-F. In cdx4ch107−/- embryos tracking of NC cells shows that the first cells to migrate are overtaken by later-migrating cells. Scale bar = 25 μm. G, H. High magnification view in a WT specimen of the leader cell (G) (blue arrow) and follower cell (H) (orange arrow). Scale bar = 5 μm. I, J. High magnification view in a cdx4ch107−/- mutant specimen of the first cell to migrate (I) (blue arrow) and a later-migrating cell (J) (orange arrow). Scale bar = 5 μm. K, L. Box plots of the area (K, units = μm2) and aspect ratio (L) of migrating NC cells in WT and cdx4ch107−/- embryos. |
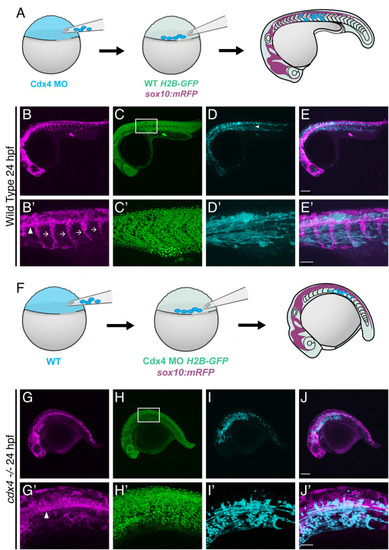
Cdx4 function is not necessary in the somitic mesoderm. A. Schematic of the transplantation approach to generate chimeric embryos with Cdx4-deficient cells in the somites. B-E. Lateral image of NC migratory streams (magenta), cell nuclei (green) showing the overall morphology of a 25 hpf chimeric embryo with Cdx4-deficient cells (cyan) in the somites. Scale bar = 150 μm. Arrowhead indicates donor cells at the myoseptum. B’-E’. Higher magnification images of boxed region from B-E. Scale bar = 50 μm. F. Schematic of the transplantation approach to generate chimeric Cdx4-deficient embryos with WT cells in the somites. G-J. Lateral image of trunk NC cells (magenta), cell nuclei (green) showing the overall morphology of a 25 hpf chimeric Cdx4-deficient embryo with WT cells (cyan) in the somites. Scale bar = 150 μm. G’-J'. Higher magnification images of boxed region from G-J. Scale bar = 50 μm. |
Reprinted from Developmental Biology, 480, Rocha, M., Kushkowski, E., Schnirman, R., Booth, C., Singh, N., Beadell, A., Prince, V.E., Zebrafish Cdx4 regulates neural crest cell specification and migratory behaviors in the posterior body, 25-38, Copyright (2021) with permission from Elsevier. Full text @ Dev. Biol.