
- Title
-
atg7-Based Autophagy Activation Reverses Doxorubicin-Induced Cardiotoxicity
- Authors
- Wang, Y., Lu, X., Wang, X., Qiu, Q., Zhu, P., Ma, L., Ma, X., Herrmann, J., Lin, X., Wang, W., Xu, X.
- Source
- Full text @ Circ. Res.
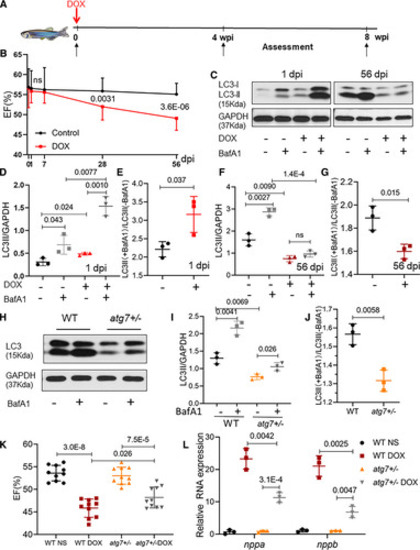
Dynamic autophagy signaling in a zebrafish adult anthracycline-induced cardiotoxicity (aAIC) model and modifying effects of atg7+/−. A, Schematics of the experimental procedure of an AIC in an adult (aAIC) zebrafish model (doxorubicin [DOX]). B, Dynamics of ejection fraction (EF)% in the DOX-treated zebrafish and the control group using a high-frequency echo system (n=15). C, Representative Western blot showing temporal changes in LC3-II (microtubule-associated protein light chain 3II) protein expression in the hearts of adult zebrafish with AIC. Bafilomycin A1 (BafA1; 30 nmol/L) was administered 4 h before the zebrafish were sacrificed. D–G, Quantification of LC3-II and the ratio between hearts treated with and without BafA1 in C, n=3 hearts/group. H, Representative images of a Western blot showing the LC3 expression in the hearts of wild-type (WT) and atg7+/− zebrafish in the absence or presence of 30 nmol/L BafA1 for 4 h. I and J, Quantification of the Western blot data in H, n=3 in each group. K, Ventricular ejection fraction of WT and atg7−/+ zebrafish with or without DOX stress 8 wk postinjection (wpi; n=10 fish/group). L, Quantification of nppa and nppb gene expression by quantitative real-time polymerase chain reaction. n=3 per group. Student t test was used in B; Mann-Whitney test in E, G, and J; Kruskal-Wallis test in D, F, I, and L; one-way ANOVA followed by post hoc Tukey test in K. dpi indicates day postinjection; LC3, light chain 3; and NS, normal saline. |

atg7 overexpression (OE) activates autophagy and exerts deleterious effects in the early phase of adult anthracycline-induced cardiotoxicity (aAIC). A, Schematics of the atg7 conditional transgenic line. B and C, Fluorescence images of hearts in fish at 1 wk after 24-h treatment with 4-hydroxytamoxifen (4HT) or ethanol. Signals in the cerulean channel represent cardiomyocyte-specific atg7 OE after conditional gene activation. D, Relative transcript level of atg7 RNA in a wild-type (WT) sibling and zebrafish with atg7 OE and with and without 4HT treatment. E, Representative Western blot showing increased LC3-II (microtubule-associated protein light chain 3II) levels in a zebrafish with atg7 OE and control-treated with bafilomycin A1 (BafA1; n=3/treatment). F, Quantification of LC3-II and the ratio of LC3-II between the hearts treated with and without BafA1 in E. G, Schematics of the experimental procedure for activating atg7 in the early phase of aAIC. H and J, High-frequency echocardiography was performed at the indicated times to quantify cardiac function. One-way ANOVA followed by Tukey post hoc test was used. I, Evaluation of nppa and nppb gene transcript expression by quantitative real-time polymerase chain reaction. n=3. Kruskal-Wallis test was used followed by post hoc Tukey test in D, F, and I. A indicates atrium; DOX, doxorubicin; EF, ejection fraction; LC3, light chain 3; NS, normal saline; O, outflow tract; V, ventricle; and wpi, wk postinjection. |

atg7 overexpression can reverse the decline in cardiac function in the late phase of adult anthracycline-induced cardiotoxicity (aAIC). A, Schematics of the experimental schedule for activating atg7 in the late phase of aAIC. B and C, High-frequency echocardiography was performed at the indicated times to quantify cardiac function (wild-type [WT]; doxorubicin [DOX]; n=15). We used bright red to represent data at the early AIC phase; dark red to represent data at the late AIC phase. One-way ANOVA followed by post hoc Tukey test was used. D, Evaluation of nppa and nppb gene transcript expression by quantitative real-time polymerase chain reaction (n=3). E, Western blotting was used to assess autophagy activity in atg7;Cre fish hearts injected with DOX with or without 4-hydroxytamoxifen (4HT) treatment, as indicated by LC3-II (microtubule-associated protein light chain 3II) expression. F, Quantification of LC3-II and the ratio of LC3-II between the hearts treated with and without bafilomycin A1 (BafA1) in E (n=3). Kruskal-Wallis test was used followed by post hoc Tukey test in D and F. EF indicates ejection fraction; EtOH, ethanol; LC3, light chain 3; NS, normal saline; and wpi, weeks postinjection. |

Food and Drug Administration–approved autophagy activators (FAAs) were ranked based on their therapeutic effects in a zebrafish embryonic anthracycline-induced cardiotoxicity (eAIC) model. A, Schematics of the experimental procedure for an eAIC model. B and C, Representative Western blot of LC3-II (microtubule-associated protein light chain 3II) in eAIC and LC3-II quantification (n=4/group). D and E, Tg(GFP-LC3) zebrafish were used to quantify LC3-II induction. Arrows indicate LC3 aggregates (n=3/group). F and G, Autophagy activators exert therapeutic effects, and autophagy inhibitors exert detrimental effects on eAIC, as indicated by changes in both mortality and cardiac function. H, The rank of the top 18 FAA drugs based on a composite score of their therapeutic effects based on survival rate, heart rate, heart function, and phenotypes. Mann-Whitney test in C; Kruskal-Wallis test followed by post hoc Tukey test in D, F, and G; Kruskal-Wallis test followed by Bonferroni post hoc test in G. BafA1 indicates bafilomycin A1; DAPI, dihydrochloride; DOX, doxorubicin; FS, fraction shortening; HR, heart rate; LC3, light chain 3; Rapa, rapamycin; and 3-MA,3-methyladenine. |

Top-ranking Food and Drug Administration–approved autophagy activators used with the embryonic anthracycline-induced cardiotoxicity (AIC) model exerted therapeutic effects in the zebrafish adult AIC (aAIC) model in a time-dependent fashion. A, Schematics of the experimental procedure for drug administration in the early phase of aAIC. B and C, High-frequency echocardiography was performed to evaluate cardiac function. D, Kaplan-Meier survival curves showing the survival of doxorubicin (DOX)-stressed adult fish after drug administration in the early phase. n=15–25. E, Schematics of the experimental procedure for drug administration in the late phase of aAIC. F and G, High-frequency echocardiography was performed 8 wk postinjection (wpi) to evaluate cardiac functions. H, Kaplan-Meier survival curves showing the survival of DOX-stressed adult zebrafish after drug administration in the late phase. n=15–25. Log-rank test was used in D and H for comparisons; one-way ANOVA followed by post hoc Tukey test in B, C, F, and G. echo indicates echocardiography; EF, ejection fraction; FS, fraction shortening; Mino, minoxidil; Pra, pravastatin; Rapa, rapamycin; Spi, spironolactone; and 3-MA,3-methyladenine. |

Top-ranking Food and Drug Administration–approved autophagy activators (FAAs), including spironolactone (Spi), pravastatin (Pra), minoxidil (Mino), and rapamycin (Rapa), exerted therapeutic effects in a mouse anthracycline-induced cardiotoxicity (AIC) model in a time-dependent fashion. A, Schematics of the experimental procedure for drug administration in the early phase of the mouse AIC model. B–D, Echocardiography was performed to evaluate cardiac functions (n=5). E, Schematics of the experimental procedure for drug administration to the AIC model mice in the late phase. F–H, Echocardiography was performed to evaluate cardiac functions (n=5; I and J) All 4 drugs attenuated the increase in serum LDH (lactate dehydrogenase) and CK-MB (creatine kinase-MB; n=8). K, All 4 drugs reversed body weight loss in the AIC model mice (n=10). One-way ANOVA followed by post hoc Tukey test was used. Log-rank test was used in K for comparisons with the model group. We applied a 0.5% aqueous solution of sodium carboxymethylcellulose (CMC) as a vehicle. DOX indicates doxorubicin; echo, echocardiography; EF, ejection fraction; IV, intravenous; LVEDD, left ventricular end-diastolic dimension; LVESD, left ventricular end-systolic dimension; and wpi, weeks postinjection. |

Spironolactone (Spi) and rapamycin (Rapa) activated autophagosome formation in an Atg7-dependent fashion. A, Representative Western blot and quantification of the relative amounts of LC3-II (microtubule-associated protein light chain 3II) in the hearts from mice injected with a single bolus of doxorubicin (DOX). Activated LC3-II and an increased response to bafilomycin A1 (BafA1; n=5/treatment) were observed. B, Representative Western blots and quantification of Atg7 from the hearts of mice administered the 4 drugs daily in the later phase. C, Representative Western blot and quantification of Atg7 from the H9C2 cardiac cell line. Spi and Rapa induced an increase in Atg7 protein levels. D, H9C2 cells were transiently transfected with mRFP-green fluorescence protein (GFP)-LC3 adenovirus and then treated with Spi and Rapa. Representative images of GFP-LC3 and mRFP-LC3 puncta are shown. E, Quantification of the yellow puncta (autophagosomes) and red puncta (autolysosomes) is shown in D. F, Quantitative real-time polymerase chain reaction was used to confirm that Atg7 transcripts were reduced by Atg7 siRNA. G, Quantitative analysis of the yellow puncta (autophagosomes) and red puncta (autolysosomes) showing that Atg7 siRNA ablates the induction of autophagosomes induced by Spi or Rapa. Kruskal-Wallis test was used followed by post hoc Tukey test in A and C; 1-way ANOVA followed by post hoc Tukey test in B, E, and G; Student test in F. CMC indicates carboxymethylcellulose; DMSO, dimethyl sulfoxide; GFP, green fluorescence protein; H9C2, rat cardiomyocytes; IV, intravenous; LC3, light chain 3; Mino, minoxidil; mGFP, monomeric green fluorescence protein; mRFP, monomeric red fluorescence protein; NC, negative control; Pra, pravastatin; and SiRNA, small interfering RNA. |
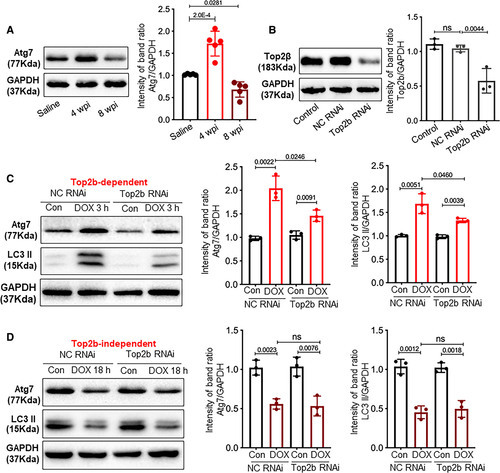
Top2b (topoisomerase 2b) is required for atg7-mediated autophagy in the early but not the late phase of anthracycline-induced cardiotoxicity (AIC). A, Temporal changes of Atg7 protein level post the first dose of doxorubicin (DOX) in the mouse AIC model. n=5 mice per group. Four weeks postinjection (wpi) would be considered as the early phase because it is equal to 1 wk post the last dose of DOX. B, H9C2 cells were transfected with the indicated siRNA. Cell lysates were analyzed by Western blots to check the knockdown effects. H9C2 cells transfected with NC RNAi or Top2b RNAi were treated by DOX for 3 h (C) or 18 h (D), then levels of Atg7 and LC3II (microtubule-associated protein light chain 3II) were examined by Western blots. Kruskal-Wallis test was used followed by post hoc Tukey test. Con indicates control; H9C2,rat cardiomyocytes; LC3,light chain 3; NC, negative control; RNAi, RNA interference; and SiRNA, small interfering RNA. |