
- Title
-
Evaluation of the Antidiabetic and Antihyperlipidemic Activity of Spondias purpurea Seeds in a Diabetic Zebrafish Model
- Authors
- Muñiz-Ramirez, A., Garcia-Campoy, A.H., Pérez Gutiérrez, R.M., Garcia Báez, E.V., Mota Flores, J.M.
- Source
- Full text @ Plants (Basel)

Figure 1. Effects of CSM extract on formation of fluorescent advanced glycation end products (AGEs) in BSA incubated with glucose. Each value represents the mean ± SE. a p ≤ 0.05 when compared to BSA/glucose at week one; b p ≤ 0.05 when compared to BSA/glucose at week two; c p ≤ 0.05 when compared to BSA/glucose at week three; d p ≤ 0.05 when compared to BSA/glucose at week four. Different letters indicate significant differences between the weeks evaluated. CSM; methanol extract from the seed of S. purpurea, AG; aminoguanidine.
|
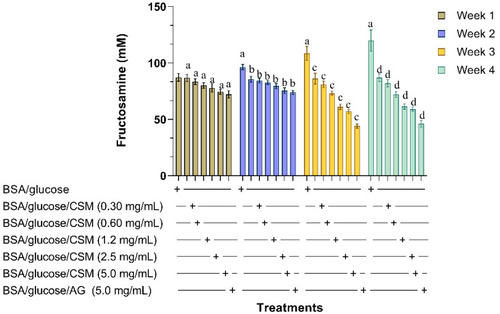
Figure 2. Effect of CSM on fructosamine levels during four weeks of incubation using the BSA/glucose system. Results are expressed as mean ± SE. a p ≤ 0.05 when compared to BSA/glucose at week one; b p ≤ 0.05 when compared to BSA/glucose at week two; c p ≤ 0.05 when compared to BSA/glucose at week three; d p ≤ 0.05 when compared to BSA/glucose at week four. Different letters indicate significant differences between the weeks evaluated. CSM; methanol extract from the seed of S. purpurea, AG; aminoguanidine.
|

Figure 3. Effect of CSM on the inhibition of Nε-(carboxymethyl) lysine (CML) after four weeks of incubation. Each value represents the mean ± SE. a p ≤ 0.05 when compared to BSA/glucose. The letters indicate significant differences between the different treatments. CSM; methanol extract from the seed of S. purpurea, AG; aminoguanidine.
|

Figure 4. CSM inhibitory activity in the BSA/methylglyoxal model. Values are expressed as a percentage of glycation inhibition. CSM; methanol extract from the seed of S. purpurea. AG; aminoguanidine.
|
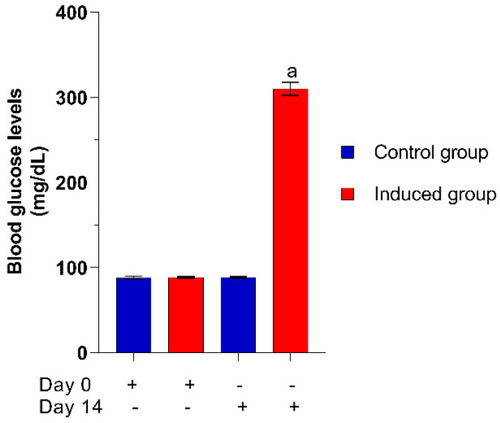
Figure 5. Elevation of blood glucose levels in zebrafish. Each value represents the mean ± SE. a p ≤ 0.05 when compared to normoglycemic control group. The letter indicates significant difference.
PHENOTYPE:
|
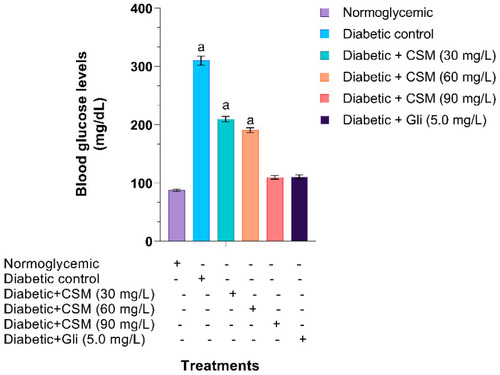
Figure 6. Effect of CSM on blood glucose levels of glucose-induced diabetic zebrafish. Each value represents the mean ± SE. a p ≤ 0.05 when compared to normoglycemic control group. The letter indicate significant differences between the different treatments. CSM; methanol extract from the seed of S. purpurea, Gli; glibenclamide.
|

Figure 7. Effect of CSM on glucose-induced zebrafish triglycerides and cholesterol levels at the end of the experimental period (14 days). Data are expressed as the mean ± SE. a p ≤ 0.05. when compared to normoglycemic control group. The letters indicate significant differences between the different treatments. CSM; methanol extract from the seed of S. purpurea, Gli; glibenclamide.
PHENOTYPE:
|
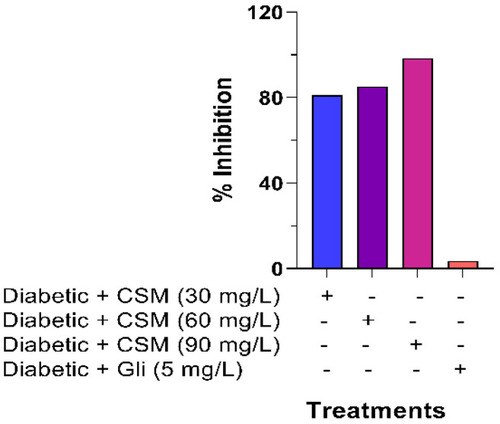
Figure 8. Effect of CSM on AGEs formation at the end of the experimental period (14 days). Values are expressed as a percentage of glycation inhibition. CSM; methanol extract from the seed of S. purpurea, Gli; glibenclamide.
|