
- Title
-
osr1 couples intermediate mesoderm cell fate with temporal dynamics of vessel progenitor cell differentiation
- Authors
- Perens, E.A., Diaz, J.T., Quesnel, A., Askary, A., Crump, J.G., Yelon, D.
- Source
- Full text @ Development

Pronephron defects in osr1 mutants are partially suppressed by hand2 loss of function. (A) osr1el593 is a TALEN-generated 7 bp deletion allele. Schematics show gene structure with location of deletion, and predicted wild-type and Osr1el593 proteins (ZF, zinc finger). (B,C) Lateral views, anterior to the left, of wild-type (B) and osr1 mutant (C) embryos at 4 days post-fertilization (dpf). osr1 mutants display severe pericardial and body wall edema (arrows). (D-T) Dorsal views, anterior to the left, of a pronephron schematic (D), and wild-type (E,I,M,Q), osr1 mutant (F,J,N,R), hand2 mutant (G,K,O,S) and hand2; osr1 double mutant (H,L,P,T) embryos at 26 h post-fertilization (hpf). In situ hybridization shows expression of wt1b (E-H) in glomerular precursors, cdh17 (I-L) throughout the tubules, slc20a1a (M-P) in the proximal convoluted tubules, and slc12a3 (Q-T) in the distal late segments. Compared with wild type (E,I,M,Q), expression is absent (F), thin and shortened anteriorly (J), reduced (N), and thin (R) in osr1 mutants; expanded in hand2 mutants (G,K,O,S); and relatively similar to wild type in hand2; osr1 double mutants (H,L,P,T). Scale bars: 200 µm (B,C); 100 µm (I-T); 25 µm (E-H). |
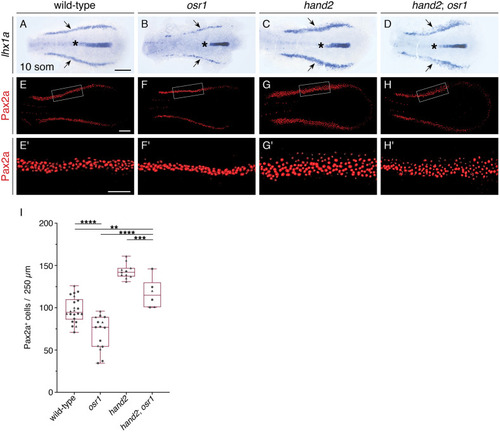
osr1 is required to promote intermediate mesoderm differentiation. (A-H) Dorsal views, anterior to the left, of the posterior mesoderm at the 10-somite stage (som). (A-D) In situ hybridization shows expression of lhx1a in the IM (arrows). Compared with wild type (A), expression is narrowed in osr1 (B), widened in hand2 (C) and irregular in hand2; osr1 (D) embryos. Expression in the notochord (asterisk) is unaffected. Unlike the width of the IM, we did not observe a change in the proximal-distal length of the IM in mutant embryos. (E-H) Three-dimensional reconstructions of Pax2a immunofluorescence in the IM of wild-type (E), osr1 (F), hand2 (G) and hand2; osr1 (H) embryos. (E′-H′) Magnification of boxed 250 µm long regions used for counting Pax2a+ cells. White dots indicate Pax2a+ nuclei. (I) Quantification of Pax2a+ cells in a 250 µm long region of the IM in the indicated genotypes. Symbols represent individual embryos (circles, average of left and right IMs; triangles, single IM; see Materials and Methods); boxes represent interquartile range; central line marks the median; whiskers indicate maximum and minimum values. P values were calculated using non-parametric Mann–Whitney U-tests: ****P<0.0001, ***P=0.0011, **P=0.0094. Scale bars: 100 µm (A-H); 50 µm (E′-H′). |

osr1 inhibits the premature emergence of lateral vessel progenitors. (A,B) Schematics depict posterior mesoderm territories, dorsal views, anterior to the left. (A′,B′) Expansion of corresponding boxed regions. (C,D,F-I) In situ hybridization shows etv2 expression in wild-type (C,F), osr1 (D,G), hand2 (H) and hand2; osr1 (I) embryos; dorsal views, anterior to the left, at the 8- (C,D) and 13- (F-I) somite stages (som). (C,D) At 8 som, etv2 is expressed in a relatively medial territory (arrowheads) on each side of the wild-type mesoderm (C). In osr1 mutants, etv2 is also expressed in some relatively lateral cells (D, arrow), and its expression is increased in a distinct proximal region (asterisk). (E) Quantification of LVPs in wild-type and osr1 mutant embryos at 6, 8, 10 and 13 som; sample sizes provided in Fig. S3E. Embryos were categorized based on the number of cells observed on whichever side of the mesoderm exhibited more LVPs. (F-I) At 13 som, etv2 is expressed in both relatively medial (arrowheads) and lateral (arrows) territories on each side of wild-type (F), osr1 (G) and hand2; osr1 (I) embryos. In hand2 mutants (H), etv2 is expressed only in the medial territory. In osr1 (G) and hand2; osr1 (I) embryos, etv2 expression is increased proximally (asterisks). (J-O) Dorsal views, anterior to the left, of in situ hybridization in wild-type embryos at 2 som (J,M), 6 som (K,N) and 10 som (L,O). Between 2 and 10 som, hand2 (J-L) remains expressed in a relatively broad domain of the wild-type posterior mesoderm. In contrast, osr1 expression is initially broad (M, arrow) but then becomes reduced in width and intensity (N,O; arrows), except proximally, where expression remains strong (asterisks), possibly representing expression in glomerular precursors (Tomar et al., 2014). Scale bars: 100 µm. |

Increased osr1 expression inhibits lateral vessel progenitor emergence and elevates IM formation.In situ hybridization (A,B,H-O) and immunofluorescence (C-F) indicate expression patterns in the posterior mesoderm; dorsal views, anterior to the left. (A,B) In contrast to wild-type embryos (A), which display etv2 expression in both medial (arrowhead) and lateral (arrow) territories, Tg(hsp70:osr1-t2A-BFP) (hs:osr1) embryos (B) display increased expression of etv2 in medial (arrowhead) and proximal (asterisk) territories, but decreased etv2 expression in lateral territories at the 13-somite stage (som). (C-F) Three-dimensional reconstructions of Pax2a and GFP immunofluorescence in wild-type (C,E) and hs:osr1 (D,F) embryos carrying Tg(etv2:egfp). While etv2:egfp expression is seen in both medial (arrowhead) and lateral (arrow) territories in wild-type at 13 som (C), etv2:egfp expression is seen only in a wide territory medial to the Pax2a+ IM in hs:osr1 embryos (D, arrowhead). (E-G) Quantification of Pax2a+ cells, as in Fig. 2E-I, demonstrates a significant increase in IM cells in hs:osr1 embryos. Symbols represent individual embryos (circles, average of left and right IMs; triangles, single IM; see Materials and Methods); boxes represent interquartile range; central line marks the median; whiskers indicate maximum and minimum values. P values were calculated using non-parametric Mann–Whitney U-tests: ***P=0.002. (H-O) Induction of osr1 expression at tailbud rescues IM and pronephron defects in osr1 mutants. Wild-type and osr1 mutant embryos carrying hs:osr1 were compared with their nontransgenic siblings; heat shock was performed at tailbud in all embryos shown. Unlike the reduced expression in osr1 mutants (J), lhx1a expression in the IM of osr1;hs:osr1 embryos (K) is comparable with wild type (H) and hs:osr1 (I) at 10 som; expression in the notochord (asterisks) was unaffected. Unlike the absent wt1b expression in the glomerular precursors (arrows) and the decreased cdh17 expression in the pronephron tubule (arrowheads) in osr1 mutants (N), wt1b and cdh17 expression in osr1;hs:osr1 (O) are comparable with wild type (L) and hs:osr1 (M). (P) Numbers of embryos exhibiting osr1 mutant phenotypes, as shown in J,N. Proportions of individuals with a mutant appearance were compared between embryos carrying hs:osr1 and their corresponding nontransgenic siblings using Fisher's exact test; P values are provided for each comparison. Notably, induction of osr1 expression at tailbud, but not at 10 som, rescued osr1 mutant phenotypes. Scale bars: 100 µm (A-E,F,H-O); 50 µm (E′,F′). |