
|
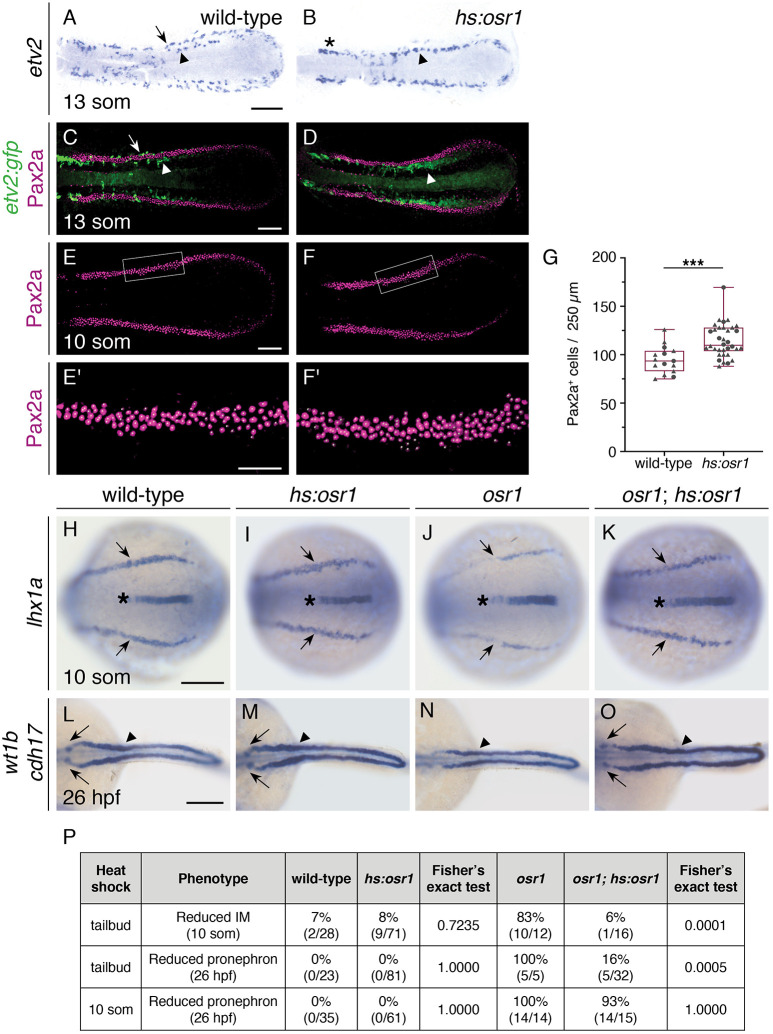
Fig. 4
Increased osr1 expression inhibits lateral vessel progenitor emergence and elevates IM formation.In situ hybridization (A,B,H-O) and immunofluorescence (C-F) indicate expression patterns in the posterior mesoderm; dorsal views, anterior to the left. (A,B) In contrast to wild-type embryos (A), which display etv2 expression in both medial (arrowhead) and lateral (arrow) territories, Tg(hsp70:osr1-t2A-BFP) (hs:osr1) embryos (B) display increased expression of etv2 in medial (arrowhead) and proximal (asterisk) territories, but decreased etv2 expression in lateral territories at the 13-somite stage (som). (C-F) Three-dimensional reconstructions of Pax2a and GFP immunofluorescence in wild-type (C,E) and hs:osr1 (D,F) embryos carrying Tg(etv2:egfp). While etv2:egfp expression is seen in both medial (arrowhead) and lateral (arrow) territories in wild-type at 13 som (C), etv2:egfp expression is seen only in a wide territory medial to the Pax2a+ IM in hs:osr1 embryos (D, arrowhead). (E-G) Quantification of Pax2a+ cells, as in Fig. 2E-I, demonstrates a significant increase in IM cells in hs:osr1 embryos. Symbols represent individual embryos (circles, average of left and right IMs; triangles, single IM; see Materials and Methods); boxes represent interquartile range; central line marks the median; whiskers indicate maximum and minimum values. P values were calculated using non-parametric Mann–Whitney U-tests: ***P=0.002. (H-O) Induction of osr1 expression at tailbud rescues IM and pronephron defects in osr1 mutants. Wild-type and osr1 mutant embryos carrying hs:osr1 were compared with their nontransgenic siblings; heat shock was performed at tailbud in all embryos shown. Unlike the reduced expression in osr1 mutants (J), lhx1a expression in the IM of osr1;hs:osr1 embryos (K) is comparable with wild type (H) and hs:osr1 (I) at 10 som; expression in the notochord (asterisks) was unaffected. Unlike the absent wt1b expression in the glomerular precursors (arrows) and the decreased cdh17 expression in the pronephron tubule (arrowheads) in osr1 mutants (N), wt1b and cdh17 expression in osr1;hs:osr1 (O) are comparable with wild type (L) and hs:osr1 (M). (P) Numbers of embryos exhibiting osr1 mutant phenotypes, as shown in J,N. Proportions of individuals with a mutant appearance were compared between embryos carrying hs:osr1 and their corresponding nontransgenic siblings using Fisher's exact test; P values are provided for each comparison. Notably, induction of osr1 expression at tailbud, but not at 10 som, rescued osr1 mutant phenotypes. Scale bars: 100 µm (A-E,F,H-O); 50 µm (E′,F′).