FIGURE SUMMARY
Title

Reduced Acrolein Detoxification in akr1a1a Zebrafish Mutants Causes Impaired Insulin Receptor Signaling and Microvascular Alterations

Authors
Qi, H., Schmöhl, F., Li, X., Qian, X., Tabler, C.T., Bennewitz, K., Sticht, C., Morgenstern, J., Fleming, T., Volk, N., Hausser, I., Heidenreich, E., Hell, R., Nawroth, P.P., Kroll, J.
Source
Full text @ Adv Sci (Weinh)

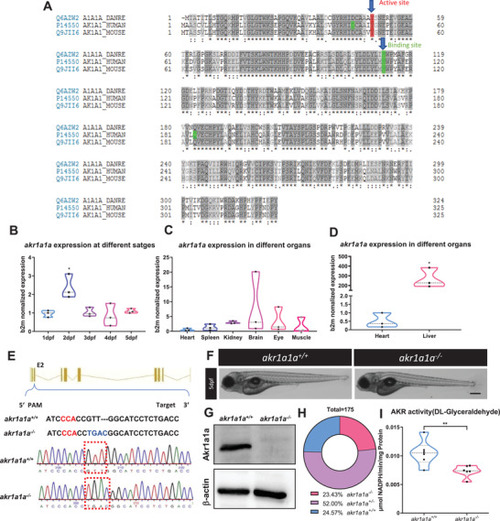
Sequence alignment of Akr1a1a across different species and generation of Akr1a1a knockout zebrafish by using CRISPR‐Cas9 technology. A) The amino acid alignment showed a high similarity between the different species on the active site (red frame) and binding site (green); first line: zebrafish AKR1a1a; second line: human AKR1a1; third line: mouse AKR1a1. B) akr1a1a mRNA expression in wild‐type zebrafish larvae showed a significant upregulation at 2 dpf. C,D) akr1a1a mRNA expressed mostly in liver of wild‐type adult zebrafish (heart as reference organ). Expression of genes was determined by RT‐qPCR and normalized to b2m. Larval stage: n = 3 clutches with 30 larvae, adult organs: n = 3 with one organ per sample. E) Akr1a1a‐CRISPR‐target site was designed in exon 2 of the akr1a1a gene and CRISPR/Cas9‐induced deletion‐insertion of four nucleotides was selected for further akr1a1a mutant line generation and maintenance. Genotype was analyzed via sequencing chromatograms of PCR‐amplified akr1a1a region, containing the akr1a1a target site. Chromatogram shows akr1a1a wild type and deletion‐insertion of four nucleotides homozygous sequencing results. F) Microscopic images showed unaltered morphology of akr1a1a−/− larvae in comparison with akr1a1a+/+ larvae at 5dpf. Black scale bar: 300 µm. G) Western blot for Akr1a1a expression in adult liver showed the loss of Akr1a1a protein in mutants. b‐actin served as loading control. n = 3, each lane represents one liver sample from according adult fish. H) Adult fish number among different genotypes was in line with the Mendelian Inheritance in the first generation of F2: akr1a1a+/+ = 43, akr1a1a+/‐ = 91, aldh3a1−/− = 41. I) akr1a1a−/− zebrafish showed decreased enzyme activity (DL‐Glyceraldehyde served as substrate) measured by spectrophotometric analysis in zebrafish lysates at 96 hpf; n = 6–11 clutches, each clutch contains 50 larvae. For statistical analysis one‐way ANOVA followed by Tukey's multiple comparison test and Student's t‐test was applied, *< 0.05. **p < 0.01. RT‐qPCR, real‐time quantitative polymerase chain reaction; dpf, day post fertilization; b2m, β2 microglobulin. PAM, protospacer‐adjacent motif.

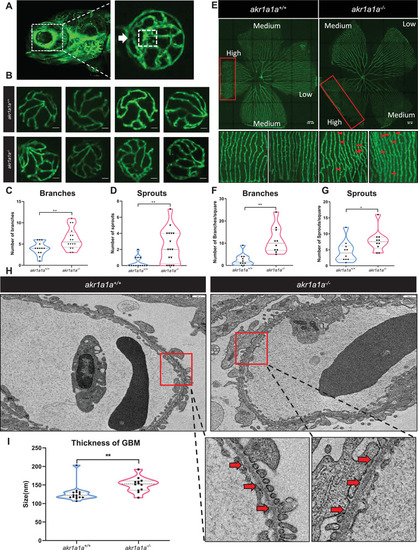
Retinal vasculature and renal alterations in akr1a1a−/− Tg(fli1:EGFP) zebrafish larvae and adults. A) Representative confocal images of the hyaloid vasculature in zebrafish larvae. White box: central hyaloid/optic artery. White arrow: circumferential inner annular hyaloid vessel. B) Representative confocal images of the hyaloid vasculature in akr1a1a+/+ and akr1a1a−/− larvae show vascular alterations in the mutants. White scale bar = 20 µm. C,D) Quantification of increased branches and sprout formation in the hyaloid vasculature in akr1a1a−/− larvae, n = 10–16 per group. E) Representative confocal images of retinal vasculature in akr1a1a+/+ and akr1a1a−/− adults. White scale bar = 200 µm. F,G) Quantification of increased branches and sprout formation in the adult retinal vasculature in akr1a1a−/− zebrafish, n = 13–16 per group. H,I) Representative electron microscopy images and quantification showed thicker GBM in adult akr1a1a−/− kidneys. Red arrows: GBM. White scale bar, 500 nm. For statistical analysis Student's t‐test was applied. *p < 0.05, **p < 0.01.

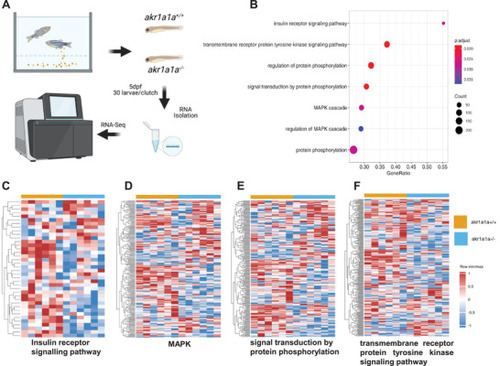
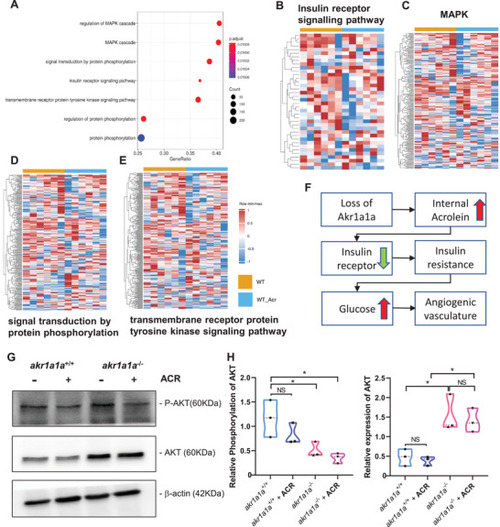
Down‐regulated insulin receptor signaling pathway and downstream pathways in akr1a1a−/− zebrafish larvae. A) Experimental design for larval RNA‐Seq. 30 larvae per clutch, 6 clutches of akr1a1a+/+ and akr1a1a−/− zebrafish larvae at 5dpf were applied for RNA isolation. B) Bubble plot showed the significantly down‐regulated biological pathways in akr1a1a−/− zebrafish larvae at 5dpf via KEGG and GOBP analysis. Heatmaps showed relative mRNA expression in C) insulin receptor signaling pathway, D) MAPK, E) signal transduction by protein phosphorylation, and F) transmembrane receptor protein tyrosine kinase signaling pathway was down‐regulated significantly in akr1a1a−/− zebrafish larvae. Higher and lower expression is displayed in red and blue, respectively. GSEA, gene set enrichment analysis. dpf, day post fertilization. KEGG, Kyoto encyclopedia of gene and genomes. GOBP, Gene ontology biological processes.

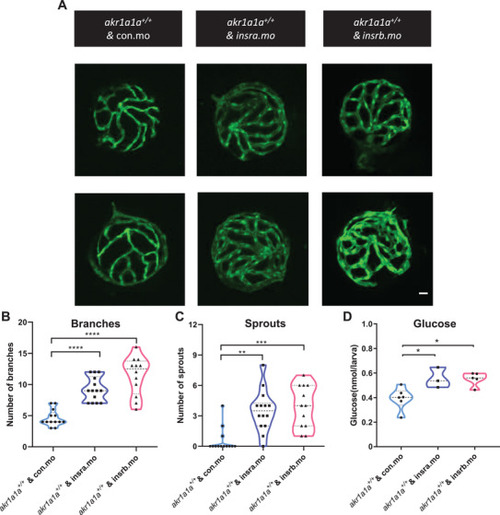
Altered glucose and insulin related gene expression in akr1a1a−/− zebrafish. A) Akr1a1a−/− larvae showed significantly increased whole‐body glucose at 5dpf. n = 8 clutches with 20 larvae. B) Blood glucose of akr1a1a−/− adults did not show any alteration in fasting state in both male and female. n = 6–15. C) In the postprandial state, akr1a1a−/− adults displayed higher blood glucose than akr1a1a+/+ adults in both male and female. n = 10–17. D) insa gene expression level showed no alteration in akr1a1a−/− larvae compared with akr1a1a+/+ larvae at 5 dpf; n = 5–6 clutches with 30 larvae. E,F) Both insra and insrb mRNA expression were down‐regulated in akr1a1a−/− larvae at 5dpf. n = 5–6 clutches with 30 larvae. G,H) insra mRNA expression showed a declining trend while insrb mRNA expression was down‐regulated significantly in akr1a1a−/− adult livers. n = 7–8. I) ACR was significantly increased in akr1a1a−/− larvae. n = 6–7 clutches with 50 larvae. J) ACR accumulated significantly in the liver of akr1a1a−/− adults, n = 5. K,L) Glyoxal and MG were unaltered in akr1a1a−/− larvae. n = 5–6 clutches with 50 larvae. M) AKR activity (ACR served as substrate) was significantly reduced in akr1a1a−/− larvae. n = 5–6 clutches with 50 larvae. N) Phosphorylated p70‐S6K(P‐p70‐S6K) was significantly decreased in the liver of akr1a1a−/− adults, n = 6. O) Pyruvic acid was significantly decreased in the liver of akr1a1a−/− adults, n = 5. P) PFK activity reduced significantly in the liver of akr1a1a−/− adults. For statistical analysis Student's t‐test was applied. *p < 0.05. **p < 0.01. ***< 0.001. NS, not significant.

insra/insrb expression silencing induced vascular alterations and caused higher glucose level at 5 dpf. A) Representative confocal images of hyaloid vasculature. White scale bar: 20 µm. B,C) Quantification of hyaloid vasculature showed significant increasing numbers of branches and sprouts in larvae upon insra/insrb silencing at 5 dpf. n = 12–14. D) Whole‐body glucose measurement showed higher glucose level in akr1a1a1+/+ larvae upon insra/insrb silencing at 5 dpf. n = 3–6 clutches with 20 larvae. For statistical analysis one‐way ANOVA followed by Tukey's multiple comparisons test was applied. *p < 0.05, **p < 0.01, ***p < 0.001, ****p < 0.0001.

ACR induced alterations on retinal hyaloid vasculature and downregulation of insra/insrb mRNA expression at 5dpf. A) Representative confocal images of hyaloid vasculature. White scale bar: 20 µm. B,C) Quantification of hyaloid vasculature showed significant increasing numbers of branches in akr1a1a1+/+ larvae incubated with 10 µm ACR. n = 13–16. White scale bar = 20 µm. D) Insa mRNA expression was unaltered in akr1a1a1+/+ larvae upon ACR treatment. n = 7 clutches with 30 larvae. E) Whole‐body glucose measurement showed higher glucose level in akr1a1a1+/+ larvae upon 10 µm ACR treatment at 5dpf. n = 4 clutches with 20 larvae. F,G) Both insra and insrb showed declined mRNA expression level in akr1a1a1+/+ larvae upon 10 µm ACR treatment. n = 7 clutches with 30 larvae. For statistical analysis Student's t‐test was applied. *p < 0.05, **p < 0.01, ***p < 0.001, ****p < 0.0001. NS, not significant.

Down‐regulated insulin receptor signaling pathways in akr1a1a+/+ zebrafish larvae upon ACR treatment. A) Bubble plot showed the significantly down‐regulated biological pathways between akr1a1a+/+ and akr1a1a+/+ zebrafish larvae after ACR treatment at 5dpf via KEGG and GOBP analysis. Heatmaps showed relative mRNA expression in B) insulin receptor signaling pathways, C) MAPK, D) signal transduction by protein phosphorylation, and E) transmembrane receptor protein tyrosine kinase signaling pathway was down‐regulated significantly in akr1a1a+/+ zebrafish larvae after ACR treatment. Higher and lower expression is displayed in red and blue, respectively. F) Concise mechanism flow chart showed the consequence of defective ACR detoxification after Akr1a1a loss. G) Representative Western blot shows total AKT and phosphorylated AKT level in different groups. H) Quantification of AKT phosphorylation and total AKT expression in akr1a1a+/+ and akr1a1a−/− zebrafish larvae treated with ACR. GESA, gene set enrichment analysis. KEGG, Kyoto encyclopedia of gene and genomes. GOBP, gene ontology biological processes. For statistical analysis one‐way ANOVA followed by Tukey's multiple comparisons test was applied. *p < 0.05. NS, not significant.

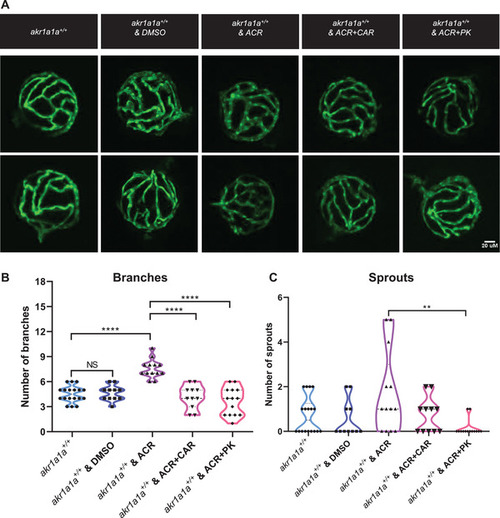
Carnosine and PK11195 can alleviate the effects caused by ACR on retinal hyaloid vasculature at 5 dpf. A) Representative confocal images of hyaloid vasculature. White scale bar: 20 µm. B) Quantification of hyaloid vasculature showed significant increasing numbers of branches in akr1a1a1+/+ larvae incubated with 10 µm ACR but rescued by carnosine (dissolved in egg water) and PK11195 (dissolved in DMSO) at 5 dpf, n = 11–18. For statistical analysis one‐way ANOVA followed by Tukey's multiple comparisons test was applied. **< 0.01, ****p < 0.001. NS, not significant. DMSO, dimethylsulfoxide. CAR, carnosine. PK, PK11195.

Acknowledgments
This image is the copyrighted work of the attributed author or publisher, and ZFIN has permission only to display this image to its users. Additional permissions should be obtained from the applicable author or publisher of the image. Full text @ Adv Sci (Weinh)