
- Title
-
RedEfish: Generation of the Polycistronic mScarlet: GSG-T2A: Ttpa Zebrafish Line
- Authors
- Head, B., La Du, J., Barton, C., Zhang, J., Wong, C., Ho, E., Tanguay, R.L., Traber, M.G.
- Source
- Full text @ Antioxidants (Basel)

ZFIN is incorporating published figure images and captions as part of an ongoing project. Figures from some publications have not yet been curated, or are not available for display because of copyright restrictions. EXPRESSION / LABELING:
|
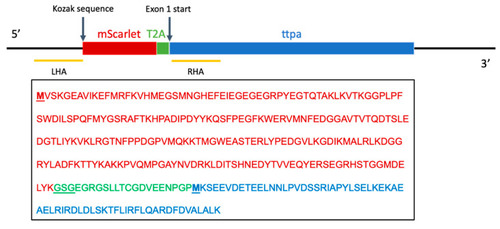
Knock-in strategy and designed protein sequence. LHA refers to the left homology arm and RHA refers to the right homology arm of the donor plasmid containing the mScarlet coding sequence. Amino acid sequences are denoted by color to indicate protein: mScarlet (red), GSG-T2A linker site (green) and exon 1 of ttpa (blue). |
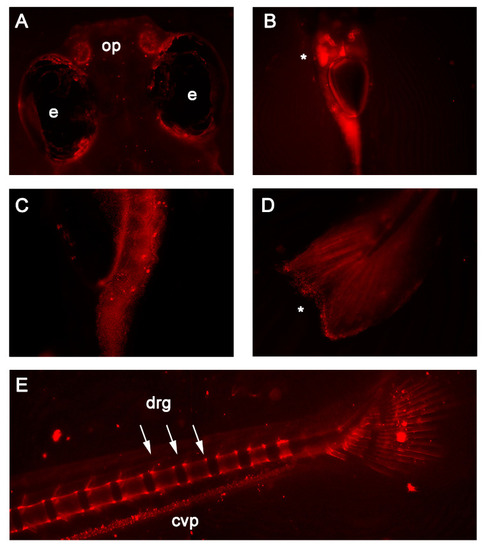
In vivo fluorescence detected in 7 and 14 days post-fertilization RedEfish. (A) mScarlet expression was unique to the olfactory pits (op) found in the RedEfish; however, some autofluorescence was detected in the pigment cells surrounding the eyes (e) in all embryos. (B) mScarlet expression was identified in the digestive tract, specifically the liver (as indicated by *). (C) More punctate expression was observed in the anterior gut region (ventral embryo positioning). (D) Punctate expression was observed also in the tail fin (as indicated by *). (E) By 14 dpf, mScarlet expression was identified in the caudal vertebrae and dorsal root ganglia (drg) and was detected in the caudal vein plexus (cpv). Some autofluorescence was noted in both RedEfish and Casper larvae. EXPRESSION / LABELING:
|
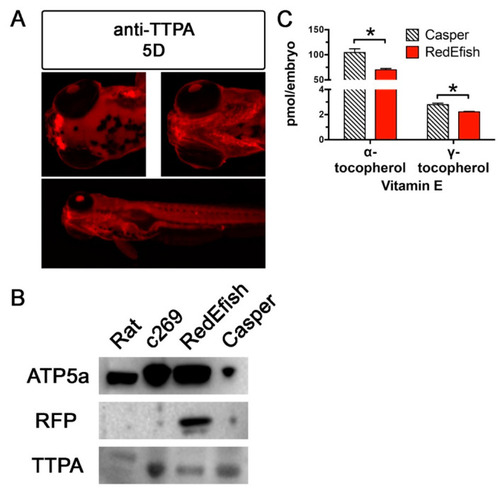
Immunolocalization and Western blot of Ttpa protein in rat liver and zebrafish embryos (c269, RedEfsh and Casper). (A) The 5D strain fish expressed Ttpa in olfactory pits, gill arches and gut lining at 5 dpf. Anti-Ttpa was used to detect and validate Ttpa protein expression in 5D embryos initially to determine regionalization followed by in vivo observation. Figure A panels were generated with the BZ-x700 microscope, processed with BZ-X Analyzer Software with image adjustments equally applied across all images in Adobe Photoshop. All images are taken at 2× magnification at the same exposure protocol. This figure was created with Adobe Photoshop, v21.2.1. (B) The same anti-Ttp antibody, used in a Western blot, confirmed that Ttpa expression is not affected by the insertion of the mScarlet coding sequence in RedEfish relative to Casper or the c269 transgenic lines. This antibody reacts poorly with rat liver protein. RFP was also detected in the RedEfish embryos, although not detected by blot in the rat liver, c269 or Casper zebrafish embryos. (C) Shown are α- and γ-tocopherol concentrations (mean ± standard deviation, pmol/embryo, * = Student’s t-test, p = 0.002 and p = 0.001, respectively) in 5 day old Casper (hatched bars) and RedEfish (red solid bars) embryos (n = 5 homogenate pools per group, n = 15 embryos per pool). Both RedEfish and Casper embryos contained lower mean γ- as compared with α-tocopherol concentrations; the comparison of logarithmically transformed data for each fish line was significantly different (p < 0.0001, Holm-Sidak’s multiple comparisons test). |