
- Title
-
Null cyp1b1 Activity in Zebrafish Leads to Variable Craniofacial Defects Associated with Altered Expression of Extracellular Matrix and Lipid Metabolism Genes
- Authors
- Alexandre-Moreno, S., Bonet-Fernández, J.M., Atienzar-Aroca, R., Aroca-Aguilar, J.D., Escribano, J.
- Source
- Full text @ Int. J. Mol. Sci.
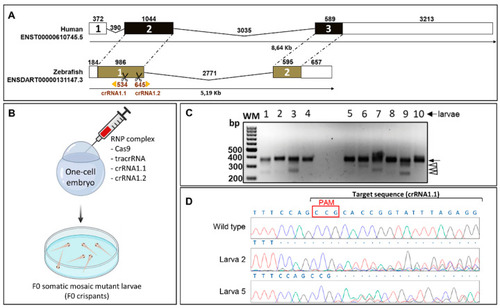
CYP1B1 gene structure and generation of the zebrafish cyp1b1 FO by CRISPR/Cas9 genome editing. (A) Comparison of exon and intron organization of human and zebrafish CYP1B1 genes. The numbers above boxes and black lines represent the length in bp of exons and introns, respectively. Untranslated regions are represented by white boxes and coding regions are represented by black and brown boxes. Dotted lines represent conserved exons. The Ensembl region comparison tool was used to obtain the scheme. Scissors indicate the position of the two CRISPR guides used to generate cyp1b1-KO (crRNA1.1 and crRNA1.2). (B) Obtention of F0 somatic mosaic mutant larvae by the RNP complex (Cas9 protein/tracrRNA/crRNA 1.1/crRNA 1.2) microinjection of one-cell embryos (F0 somatic mosaic crispants, n = 215). The two crRNAs were injected simultaneously to generate cyp1b1 deletions. The scheme was created with the Biorender tool (https://biorender.com/) (accessed on 21 April 2021). (C) Analysis of the CRISPR/Cas9 efficiency by agarose electrophoresis of cyp1b1 exon 1 PCR products amplified from 10 F0 larvae (48 hpf). Black arrow: main PCR product. Arrowheads: different exon 1 deletions. (D) Sanger sequencing of the main band (arrow) detected in (C). The electropherograms of two larvae (2 and 5) are shown as representative results of this analysis. Overlapping peaks indicate the presence of different mutations. Red box: protospacer adjacent motif (PAM) site. |
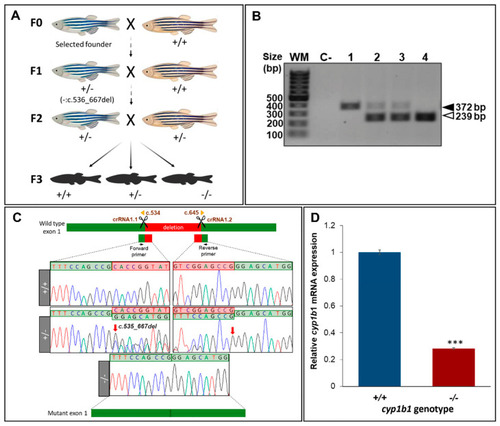
Generation and molecular characterisation of a cyp1b1-KO zebrafish line using CRISPR/Cas9 genome editing. (A) Stepwise procedure followed to generate the KO line. Adult F0 zebrafish were crossed with wildtype AB animals and the offspring were genotyped by PCR and agarose gel electrophoresis to identify germline transmission of cyp1b1 deletions (F0 founders). The selected F0 founder was mated with a wildtype AB animal to obtain mutant F1 heterozygotes that were further outcrossed to segregate off-target mutations in the F2 generation. F2 heterozygotes were inbred to obtain F3 fishes. The scheme was created with the Biorender tool (https://biorender.com/) (accessed on 21 April 2021). (B). Genotyping by PCR and agarose gel electrophoresis of a 133-bp cyp1b1 deletion in the F3 generation. Representative examples of the three genotypes are shown. Black arrowhead: wildtype allele (372 bp). White arrowhead: mutant allele (239 bp). (C) Sanger sequencing of the selected mutation. The top diagram indicates localization of the identified deletion in cyp1b1 exon 1. Scissors: DNA cleavage sites targeted by the two crRNAs. The numbers correspond to cDNA nucleotide positions. Red arrows in the electropherograms indicate the 5′ and 3′ ends of the deletion. Deleted nucleotides are indicated in the red background. The diagram in the bottom represents the mutant exon. (D) Decreased mRNA levels in cyp1b1-KO zebrafish. Pools of 45 F4 zebrafish larvae (48 hpf) were used to quantify relative cyp1b1 mRNA levels by RT-qPCR. The values represent the average of three independent experiments carried out in triplicate. Asterisks indicate statistical significance compared to the wild type, p < 0.001 (***). |
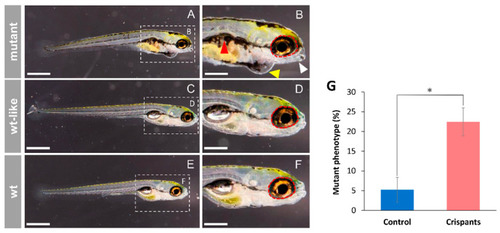
Cyp1b1 F0 crispants’ phenotypes (144 hpf). (A–D) One-cell embryos were microinjected with CRISPR/Cas9 ribonucleoprotein complexes targeting cyp1b1 exon 1. Crispants’ morphology was assessed microscopically at 144 hpf. (E,F) Non-injected larvae were used as controls (wt). White arrow: lower jaw underdevelopment. Red arrowhead: altered swim bladder development. Red dotted circle: wildtype ocular periphery is indicated as a reference to show microphthalmia. Yellow arrowhead: pericardial edema. Scale bar in (A,C,E) = 500 µm. Scale bar in (B,D,F) = 250 µm. (G) Proportion of F0 mutant phenotypes. The controls were microinjected with all CRISPR/Cas9 reagents except crRNAs. Asterisks indicate statistical significance compared to the control, p < 0.05 (*). The values correspond to the means ± SEM of three independent experiments (50–80 embryos per group and experiment). PHENOTYPE:
|
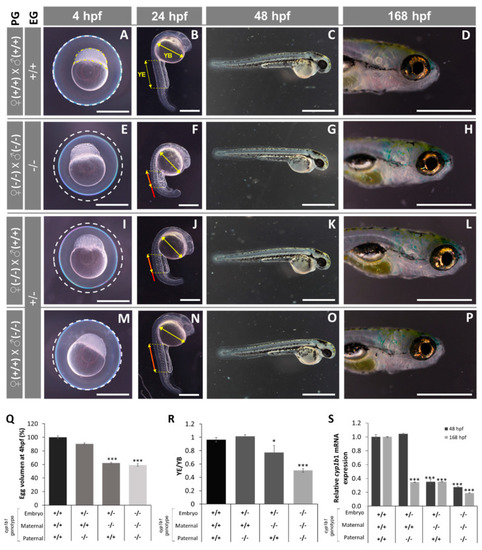
Early (4 -168 hpf) phenotypes of the established cyp1b1-KO zebrafish line. (A–P) The phenotypes were analyzed in F4 zebrafish resulting from inbreeding of young (< six months) F3 siblings. Progenitors’ genotypes (PG) and embryos’ genotypes (EG) are indicated on the left. (A,E,I,M) The difference in egg volume (white dotted line). Yellow dotted line: animal pole. (B,F,J,N) The differences in yolk extension (YE) length and yolk ball’s (YB) largest diameter. Red line: wildtype YE length extrapolated to embryos with different genotypes. No differences were observed in larval development at 48 hpf and 168 hpf. The images are representative of the results observed in at least 10 embryos per experimental group. Scale bars represent 500 µm in 4 hpf, 24 hpf and 168 hpf photographs and 1000 µm in 48 hpf photographs. (Q) Relative egg volume at 4 hpf. The values are expressed as the percentage of the volume of wildtype eggs (n = 20). (R) YE/YB ratio at 24 hpf (n = 3–6). (S) Cyp1b1 mRNA levels in zebrafish at 48 hpf and 168 hpf. Pools of 45 F4 zebrafish at 48 and 168 hpf were used to calculate cyp1b1 mRNA levels by RT-qPCR. The values are expressed as relative expression levels normalized to the wild type. Three independent experiments carried out in triplicate were used for calculation of mean expression values in each sample. Asterisks indicate statistical significance compared to the wild type, p < 0.05 (*), p < 0.001 (***). |
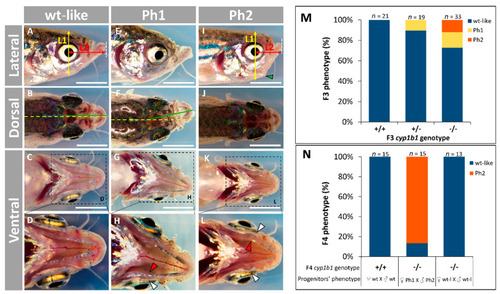
Adult (four months) craniofacial phenotypes in the established PHENOTYPE:
|
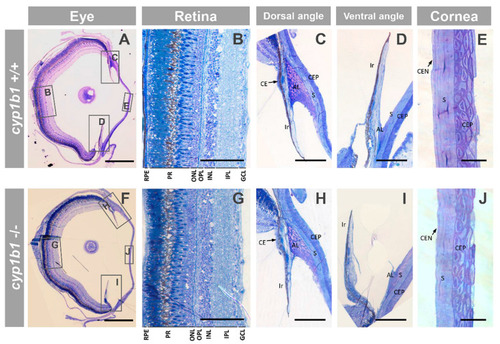
Ocular histology of adult (seven months) cyp1b1-KO zebrafish with Ph2 craniofacial alterations (F3). (A–J) Semithin (500 nm) tissue sections were stained with toluidine blue. The squares and rectangles indicate the areas of the images magnified in the indicated panels. No significant differences were observed between the eyes of wildtype and cyp1b1-KO zebrafish siblings. Scale bar in (A,F): 500 μm. Scale bar in (B–D,G–I): 100 μm. Scale bar in (E,J): 25 μm. RPE: retinal pigment epithelium; PR: photoreceptors; ONL: outer nuclear layer; OPL: outer plexiform layer; INL: inner nuclear layer; IPL: inner plexiform layer; GCL: ganglion cell layer; CE: ciliary epithelium; AL: annular ligament; CEP: corneal epithelium; CEN: corneal endothelium; S: stroma. The images are representative of the results observed in three fishes of each genotype. Three tissue sections per eye were analyzed. PHENOTYPE:
|
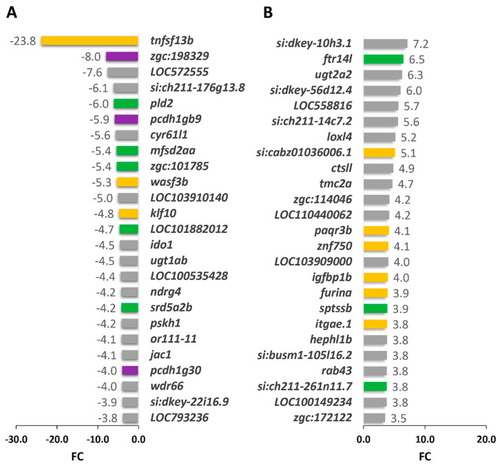
Top 25 DEGS in cyp1b1-KO vs. wildtype seven-dpf zebrafish larvae. (A) Down- and (B) upregulated genes identified by high-throughput RNA sequencing with significant differences in the comparison. Yellow bars: development signaling genes. Green bars: lipid metabolism genes. Purple bars: extracellular matrix and cell adhesion genes. Grey: down- and upregulated genes from other functional pathways. |
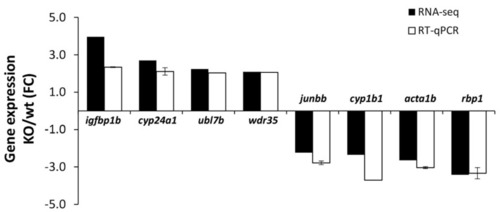
Confirmation by RT-qPCR of the differential expression of the selected genes identified in the RNA-seq analysis of cyp1b1-KO zebrafish. RT-qPCR was carried out in triplicate. |