FIGURE SUMMARY
Title

Candida auris Cell Wall Mannosylation Contributes to Neutrophil Evasion through Pathways Divergent from Candida albicans and Candida glabrata

Authors
Horton, M.V., Johnson, C.J., Zarnowski, R., Andes, B.D., Schoen, T.J., Kernien, J.F., Lowman, D., Kruppa, M.D., Ma, Z., Williams, D.L., Huttenlocher, A., Nett, J.E.
Source
Full text @ mSphere

C. auris evasion of neutrophil phagocytosis is demonstrated across multiple strains. Human neutrophils from healthy donors were incubated for 1 h with C. albicans SN250 or C. auris strains labeled with calcofluor white and subsequently imaged via fluorescence microscopy. The numbers of neutrophils engulfing fungal cells were counted and the percentages of total engaged neutrophils were calculated. High power fields (n = 8 to 10) were examined with neutrophils from at least two donors. *, P < 0.05 by one-way ANOVA with Holm-Sidak multiple comparisons to C. albicans.

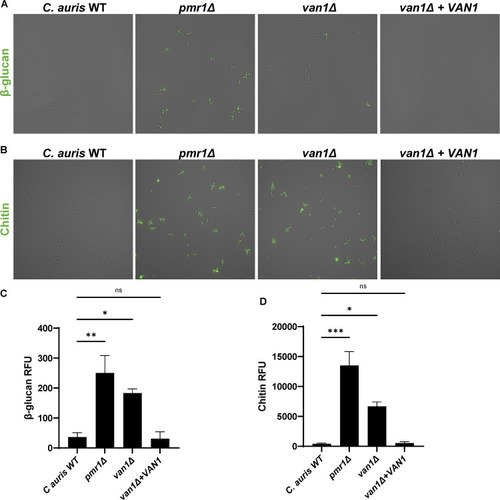
C. auris mannosylation pathway mutants are susceptible to neutrophil attack. (A) C. auris strains were incubated with human neutrophils for 1 h and were subsequently imaged via scanning electron microscopy. Images are 10,000× magnification, measurement bars represent 1 μm. (B and C) Human neutrophils were labeled with calcein-AM (green) and cocultured with individual C. auris strains labeled with calcofluor white (blue) for 1 h and imaged via fluorescence microscopy (B). The numbers of neutrophils engulfing fungal cells were counted and the percentages of total engaged neutrophils were calculated (C); n ≥ 3, mean with standard error of the mean (SEM) shown. (D) Individual C. auris strains were cultured with human neutrophils for 4 h and viable burden was estimated by PrestoBlue metabolic activity following neutrophil lysis; n = 3, mean with standard deviation shown. *, P < 0.05; **, P < 0.01; ***, P < 0.001; ****, P < 0.0001; ns, not significant by one-way ANOVA with Holm-Sidak multiple comparisons to C. auris WT.

C. aurispmr1Δ and van1Δ strains display an altered cell wall structure that contains less mannan. (A) C. auris yeast were imaged via transmission electron microscopy at 383,000× magnification, and scale bars represent 50 nm. Brackets denote distinct cell wall layers: G+C, β-glucan and chitin; M, mannan. (B) The monosaccharide compositions of cell walls were measured by gas chromatography, n = 5, mean with SEM shown, *, P < 0.05; ns, not significant by one-way ANOVA with Holm-Sidak multiple comparisons to C. auris WT. Rha, rhamnose; Rib, ribose; Ara, arabinose; Xyl, xylose; Man, mannose; Glu, glucose. (C and D) The structures of isolated mannans were analyzed by 1H NMR and COSY spectra. C shows the 1H NMR spectra for each strain following mannan isolation. In panel D, the intensities were adjusted to the resonance assigned to sidechain-linked backbone α1-6-linked mannosyl repeat units (5.07 ppm) to compare mannan structures.

C. aurispmr1Δ and van1Δ strains display increased cell surface PAMPs. (A) Cell surface β-glucan was labeled using Fc:dectin-1 protein with Alexa Fluor 488-conjugated anti-human IgG Fc antibody and imaged by fluorescence microscopy. (B) Cell surface chitin was labeled with wheat germ agglutinin conjugated to fluorescein isothiocyanate (WGA-FITC) and assessed by fluorescence microscopy. (C and D) Total surface β-glucan and chitin were quantified by plate reader measurements of fluorescence, n = 3 mean with SEM shown, *, P < 0.05; **, P < 0.01; ***, P < 0.001 by one-way ANOVA with Holm-Sidak multiple comparisons to C. auris WT; ns, not significant.

C. auris mannan mutants stimulate increased neutrophil recruitment in the larval zebrafish hindbrain. C. auris strains were injected into the hindbrains of larvae from a cross between the Tg(lyzC:RFP) and Tg(mpeg:GFP) lines at 2 days postfertilization. Fluorescence microscopy was utilized to measure recruitment of neutrophils to the hindbrain at 4, 24, and 72 h postejection. (A) At each time point, fluorescent neutrophils were manually enumerated from maximum intensity projections from z-stacks; n = 9 to 23, experiments were performed in three replicates; the mean with SEM are shown; *, P < 0.05; ns, not significant by Brown-Forsythe and Welch ANOVA with Dunnett’s T3 multiple comparisons to C. auris WT. (B) Representative fluorescence microscopy images of neutrophil recruitment to zebrafish hindbrain are shown (magenta = neutrophils, cyan = C. auris cells). Scale bar = 20 μm.

C. aurispmr1Δ and van1Δ strains grow to lower burdens in the larval zebrafish hindbrain in the presence of neutrophils. Wild-type (A) or transgenic zebrafish expressing a dominant Rac2D57N mutation in neutrophils (B) were inoculated with C. auris by hindbrain injection. Fungal burden was quantified at 0, 1, 3, and/or 5 days postinfection by homogenizing whole larvae and plating for CFU. n = 20 to 24; experiments were performed in three replicates; mean with SEM are shown; *, P < 0.05; ns, not significant by Brown-Forsythe and Welch ANOVA with Dunnett’s T3 multiple comparisons to C. auris WT.

PMR1 and VAN1 do not influence neutrophil engagement of Candida albicans or Candida glabrata. Human neutrophils were labeled with calcein-AM and cocultured with calcofluor white-labeled C. albicans (A) or C. glabrata (B) for 1 h and imaged via fluorescence microscopy. The number of neutrophils engulfing yeast cells was counted and the percentage of total engaged neutrophils was calculated, n = 3, mean with SEM are shown; analyzed by one-way ANOVA with Holm-Sidak multiple comparisons to REF, ns = not significant. Representative fluorescence microscopy images are shown for C. albicans (C) and C. glabrata (D).

Acknowledgments
This image is the copyrighted work of the attributed author or publisher, and ZFIN has permission only to display this image to its users. Additional permissions should be obtained from the applicable author or publisher of the image. Full text @ mSphere