FIGURE SUMMARY
Title

Zebrafish Chromosome 14 Gene Differential Expression in the fmr1hu2787 Model of Fragile X Syndrome

Authors
Barthelson, K., Baer, L., Dong, Y., Hand, M., Pujic, Z., Newman, M., Goodhill, G.J., Richards, R.I., Pederson, S.M., Lardelli, M.
Source
Full text @ Front Genet

ZFIN is incorporating published figure images and captions as part of an ongoing project. Figures from some publications have not yet been curated, or are not available for display because of copyright restrictions.

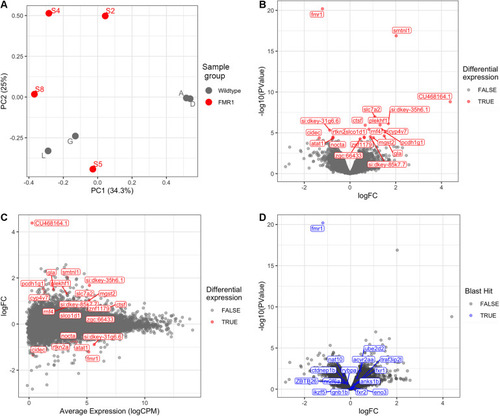
Transcriptome analysis of fmr1hu2787/hu2787 vs. wild type entire embryos at 2 dpf. (A) Principal Component (PC) analysis of larval wild type (A, D, G, L) and fmr1hu2787/hu2787 (S2, S4, S5, S8) RNA-seq data. (B) Volcano plot of differential gene expression. (C) Mean-difference (MD) plot showing the average levels of expression of RNAs plotted against fold change differences in expression between mutant and wild type embryos. (D) Volcano plot of differential expression as in b, but indicating genes sharing some degree of sequence homology with fmr1 (indicated in blue). No significantly increased expression is seen.

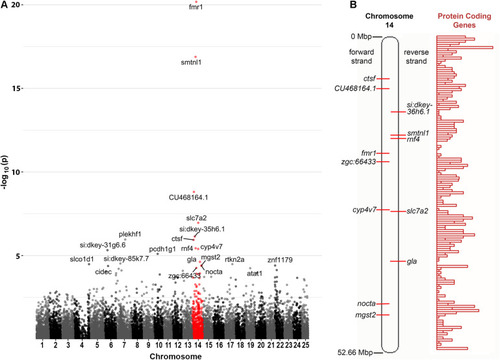
Chromosome distribution of DE genes. (A) Manhattan plot of p-values for differential expression of genes on the chromosomes of zebrafish. An enrichment for DE genes on Chromosome 14 is apparent with possible enrichment also for genes on Chromosome 22 (see also Supplementary Data File 2). (B) A diagram of zebrafish Chromosome 14 taken from https://asia.ensembl.org (Yates et al., 2020) and including a representation of relative protein coding gene density along the chromosome. Loci for the Chromosome 14 genes found to be DE in fmr1hu2787/hu2787 2 dpf embryos are indicated (see also Table 1).

Acknowledgments
This image is the copyrighted work of the attributed author or publisher, and ZFIN has permission only to display this image to its users. Additional permissions should be obtained from the applicable author or publisher of the image. Full text @ Front Genet