IMAGE

FIGURE 2

ID
ZDB-IMAGE-210623-60
Source
Figures for Barthelson et al., 2021
Image
Figure Caption

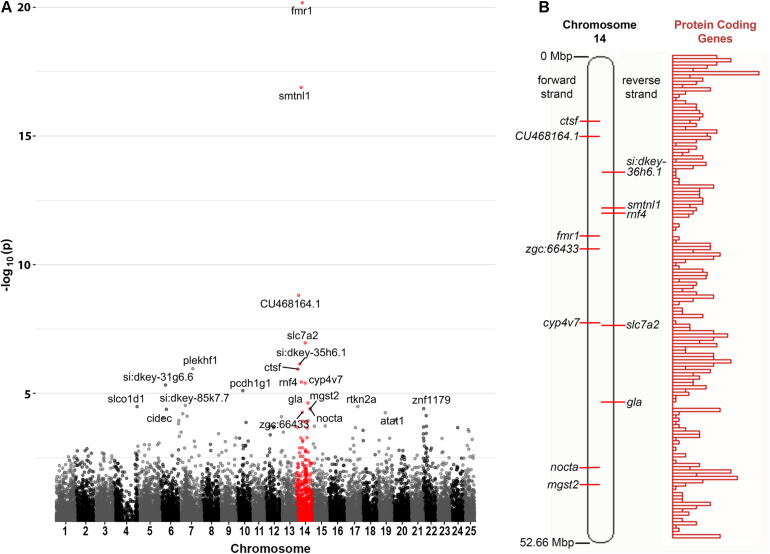
FIGURE 2

Chromosome distribution of DE genes. (A) Manhattan plot of p-values for differential expression of genes on the chromosomes of zebrafish. An enrichment for DE genes on Chromosome 14 is apparent with possible enrichment also for genes on Chromosome 22 (see also Supplementary Data File 2). (B) A diagram of zebrafish Chromosome 14 taken from https://asia.ensembl.org (Yates et al., 2020) and including a representation of relative protein coding gene density along the chromosome. Loci for the Chromosome 14 genes found to be DE in fmr1hu2787/hu2787 2 dpf embryos are indicated (see also Table 1).

Acknowledgments
This image is the copyrighted work of the attributed author or publisher, and ZFIN has permission only to display this image to its users. Additional permissions should be obtained from the applicable author or publisher of the image. Full text @ Front Genet