
- Title
-
Spatiotemporal imaging and pharmacokinetics of fluorescent compounds in zebrafish eleuthero-embryos after different routes of administration
- Authors
- Guarin, M., Faelens, R., Giusti, A., De Croze, N., Léonard, M., Cabooter, D., Annaert, P., de Witte, P., Ny, A.
- Source
- Full text @ Sci. Rep.

Representative pictures of the spatiotemporal distribution of the fluorescent compound S-CY3A. The eleuthero-embryos were exposed to the dye by immersion (10 µM) or microinjection (2 mg/kg) in the pericardial cavity (PC), intraperitoneally (IP) and in the yolk sac (IY), or by a combination of immersion and PC microinjection, for 48 h starting from 3 dpf. Selected images arranged in MS PowerPoint and GIMP (version 2.10.24 |
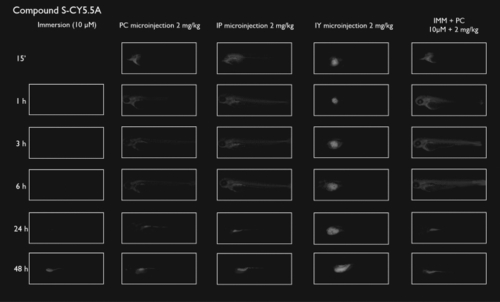
Representative pictures of the spatiotemporal distribution of the fluorescent compound S-CY5.5A. The eleuthero-embryos were exposed to the dye by immersion (10 µM) or microinjection (2 mg/kg) in the pericardial cavity (PC), intraperitoneally (IP) and in the yolk sac (IY), or by a combination of immersion and PC microinjection, for 48 h starting from 3 dpf. Selected images arranged in MS PowerPoint and GIMP (version 2.10.24 |
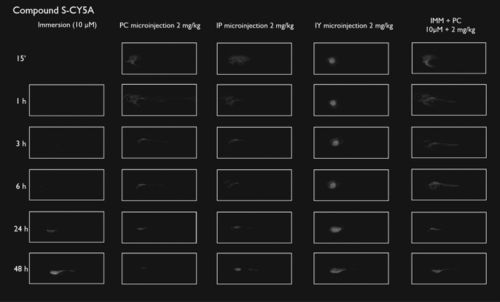
Representative pictures of the spatiotemporal distribution of the fluorescent compound S-CY5A. The eleuthero-embryos were exposed to the dye by immersion (10 µM) or microinjection (2 mg/kg) in the pericardial cavity (PC), intraperitoneally (IP) and in the yolk sac (IY), or by a combination of immersion and PC microinjection, for 48 h starting from 3 dpf. Selected images arranged in MS PowerPoint and GIMP (version 2.10.24 |

Representative pictures of the spatiotemporal distribution of the fluorescent compound FAMA. The eleuthero-embryos were exposed to the dye by immersion (10 µM) or microinjection (2 mg/kg) in the pericardial cavity (PC), intraperitoneally (IP) and in the yolk sac (IY), or by a combination of immersion and PC microinjection, for 48 h starting from 3 dpf. Selected images arranged in MS PowerPoint and GIMP (version 2.10.24 |
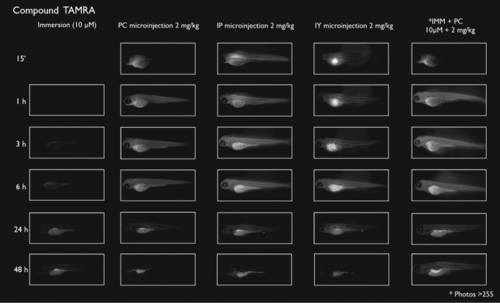
Representative pictures of the spatiotemporal distribution of the fluorescent compound TAMRA. The eleuthero-embryos were exposed to the dye by immersion (10 µM) or microinjection (2 mg/kg) in the pericardial cavity (PC), intraperitoneally (IP) and in the yolk sac (IY), or by a combination of immersion and PC microinjection, for 48 h starting from 3 dpf. Selected images arranged in MS PowerPoint and GIMP (version 2.10.24 |

Representative pictures of the spatiotemporal distribution of the fluorescent compound R6GA. The eleuthero-embryos were exposed to the dye by immersion (10 µM) or microinjection (2 mg/kg) in the pericardial cavity (PC), intraperitoneally (IP) and in the yolk sac (IY), or by a combination of immersion and PC microinjection, for 48 h starting from 3 dpf. Selected images arranged in MS PowerPoint and GIMP (version 2.10.24 |

Representative pictures of the spatiotemporal distribution of the fluorescent compound CY3A. The eleuthero-embryos were exposed to the dye by immersion (10 µM) or microinjection (2 mg/kg) in the pericardial cavity (PC), intraperitoneally (IP) and in the yolk sac (IY), or by a combination of immersion and PC microinjection, for 48 h starting from 3 dpf. Staining of neuromast cells of the lateral line is visible 1 h post-immersion. Selected images arranged in MS PowerPoint and GIMP (version 2.10.24 |
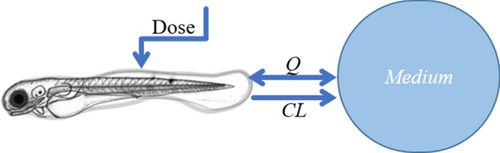
Schematic illustration of the 1-compartment model used to calculate PK parameters of the fluorescent compounds in the zebrafish eleuthero-embryo. One-way active clearance |

Fluorescence-time curves for all compounds and administration routes, with excluded data points marked as X symbols. Model prediction is presented as dotted line, model-predicted equilibrium fluorescence after immersion as solid horizontal line. The image was produced using R (version 4.0.3 https://www.r-project.org/ 2020) and colours arranged in GIMP (version 2.10.24 https://www.gimp.org/ 2021) Software. |
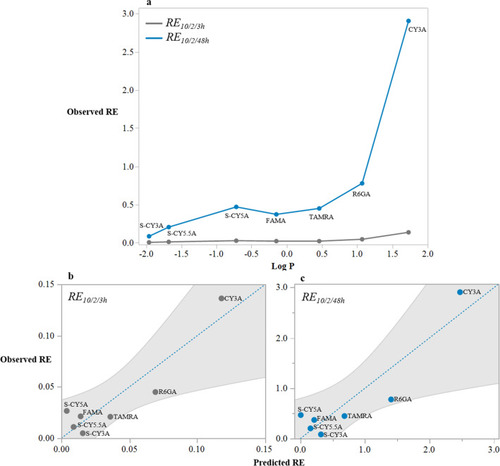
Relationship between observed |

Histograms of Relative |