IMAGE

Figure 11

ID
ZDB-IMAGE-210614-33
Source
Figures for Guarin et al., 2021
Image
Figure Caption

Figure 11

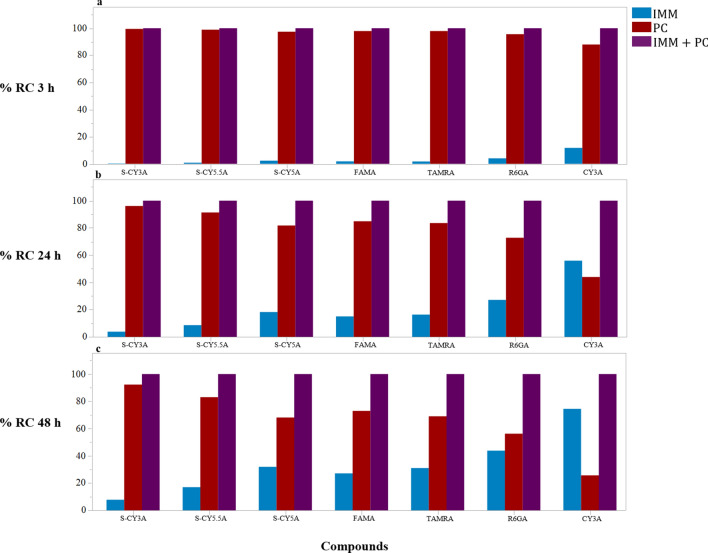
Histograms of Relative AUC contribution (RCh) of the immersion and PC exposure route as compared to AUC obtained after combination treatment for a 3 h treatment (a), 24 h treatment (b) and a 48 h treatment (b). The image was produced using JMP (version 15.1. SAS Institute Inc., Cary, NC, 2019) and arranged in GIMP (version 2.10.24 https://www.gimp.org/ 2021) Software.

Acknowledgments
This image is the copyrighted work of the attributed author or publisher, and ZFIN has permission only to display this image to its users. Additional permissions should be obtained from the applicable author or publisher of the image. Full text @ Sci. Rep.