FIGURE SUMMARY
Title

Reinforcing one-carbon metabolism via folic acid/Folr1 promotes β-cell differentiation

Authors
Karampelias, C., Rezanejad, H., Rosko, M., Duan, L., Lu, J., Pazzagli, L., Bertolino, P., Cesta, C.E., Liu, X., Korbutt, G.S., Andersson, O.
Source
Full text @ Nat. Commun.

Genetic screen identifies <italic>folr1</italic> as an inducer of β-cell regeneration in zebrafish.

a Schematic showing the experimental design of the genetic screen for inducers of β-cell regeneration. Briefly, primary islets were isolated from zebrafish larvae directly after β-cell ablation. RNA was extracted, and RNA-Seq was performed. Then, using the signalP algorithm, we identified the proteins with a signal peptide mediating secretion and cloned them under the control of the actb2 promoter. The constructs were injected into 1-cell-stage embryos to induce mosaic overexpression, and the number of regenerating β-cells was quantified two days after β-cell ablation. b Results of the genetic screen for inducers of β-cell regeneration. Blue bars depict three different negative controls of the regeneration assay, green bars show the tested proteins and the white bar shows the regenerating β-cells for the positive control igfbp1a. Data for the negative controls were pooled from 4 independent experiments. If there was an observed increase in β-cell regeneration in the first experiment, constructs were retested a second time, and the data shown in the graph were pooled from both independent replicates. The Kruskal–Wallis test followed by Dunn’s multiple comparison test was performed. n = 137 (uninjected control), n = 108 (transposase control), n = 83 (actb2:H2BmCherry), n = 10 (actb2:adma), n = 42 (actb2:agt), n = 57 (actb2:apoa1a), n = 37 (actb2:bgnb), n = 26 (actb2:ephrina2), n = 38 (actb2:folr1), n = 39 (actb2:galn), n = 24 (actb2:ier3ip1), n = 58 (actb2:penka), n = 26 (actb2:serpina7), n = 12 (actb2:sfrp5), n = 54 (actb2:sostdc1a), n = 63 (actb2:spint1b), n = 62 (actb2:zgc:163030), n = 26 (actb2:zgc:174259), n = 16 (actb2:zgc:198329) and n = 12 (actb2:igfbp1a) biologically independent zebrafish larvae were used for the quantification of β-cells. ****P < 0.001, **P = 0.0061 compared to uninjected control. Data are presented as mean values ± SEM.

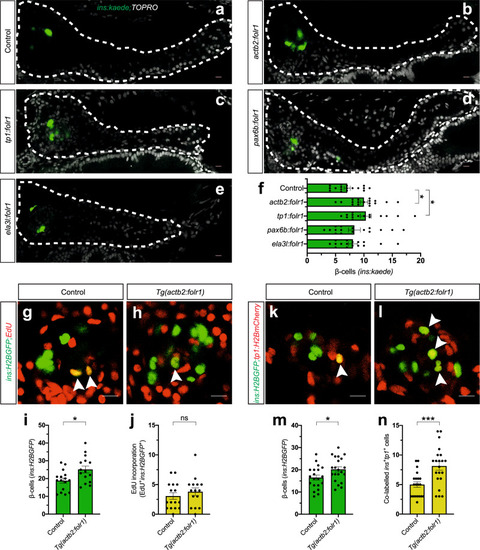
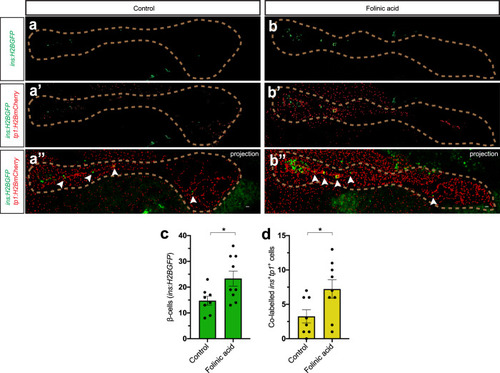
a–f Single-plane confocal pictures of pancreata in control (a), actb2:folr1 (b), tp1:folr1 (c), pax6b:folr1 (d), and ela3l:folr1 (e) larvae on the Tg(ins:kaede);Tg(ins:CFP-NTR) background, following two days of β-cell regeneration. TOPRO was used to counterstain nuclei, and the whole pancreas is outlined with a white dashed line. Quantification of the pancreatic β-cells showed that actb2:folr1 and tp1:folr1 overexpression had comparable increases in the β-cell regeneration assay (f). Scale bar, 10 μm. n = 17 (control), n = 17 (actb2:folr1), n = 15 (tp1:folr1), n = 16 (pax6b:folr1), and n = 16 (ela3l:folr1) biologically independent zebrafish larvae used for the quantification of β-cells. Data are presented as mean values ± SEM. One-way ANOVA was performed followed by Dunnett’s multiple comparison tests. f *P = 0.0348 (control vs. actb2:folr1), *P = 0.0202 (control vs tp1:folr1). g–j Single-plane confocal images of islets in control (g) and Tg(actb2:folr1) (h) larvae on the Tg(ins:H2BGFP);Tg(ins:flag-NTR) background following two days of β-cell regeneration while incubated with EdU to label proliferating cells. Quantification showed an increase in β-cell regeneration in the Tg(actb2:folr1) line (i), but no change in the number of β-cells incorporating EdU was observed (j). Arrowheads point to EdU+ins:H2BGFP+ cells. Scale bar, 10 μm. n = 16 control and n = 15 Tg(actb2:folr1) biologically independent zebrafish larvae were used for the quantification of this experiment. Data are presented as mean values ± SEM. Unpaired two-tailed Student’s t test was used to assess significance. i *P = 0.0122, j nonsignificant (ns), P = 0.3943. k–n Single-plane confocal images of islets in control (k) and Tg(actb2:folr1) (l) larvae on the Tg(ins:H2BGFP);Tg(ins:flag-NTR);Tg(tp1:H2BmCherry) background, used to lineage trace the ductal cells of the pancreas, after β-cell ablation. Quantification showed an increase in the number of regenerating β-cells (m) colabeled with the ductal cell marker tp1:H2BmCherry (n). Arrowheads point to tp1:H2BmCherry+ins:H2BGFP+ cells. Data for m, n were pooled from two independent experiments. Scale bar, 10 μm. n = 20 control and n = 21 Tg(actb2:folr1) biologically independent zebrafish larvae were used for the quantification of samples pooled from two independent experiments. Data are presented as mean values ± SEM. Unpaired two-tailed Student’s t test was used to assess significance for (m) *P = 0.0306. The Mann–Whitney two-tailed test was used for (n) ***P = 0.0010.

Expression of Folr1 in the pancreata of different organisms.

aa”’, Immunostaining of whole-mount zebrafish larvae at 6 dpf using a Folr1 antibody (a). Ductal cells were immunostained with the zebrafish duct-specific marker Nkx6.1 (a’), and nuclei were counterstained with DAPI (a”). The white dashed line outlines the islet of the zebrafish larvae. Arrowheads (a”’) point to the Folr1+ ductal cells. Scale bar, 10 μm. Representative images are shown from one larva. The staining results have been repeated in at least four zebrafish larvae and three biological replicates. b, c Representative pictures of an islet (b) and a duct (c) from adult mouse pancreatic sections immunostained for FOLR1, GLUCAGON (α-cell marker), and DBA (ductal cell marker) and counterstained with DAPI. Scale bar, 20 μm. Sections from three biological replicates showed the same expression pattern of FOLR1. di Expression of folate receptor homologs in the human pancreas. Violin plots showing single-cell RNA-Seq expression in endocrine (d), acinar (e), and ductal (f) pancreatic cells showed significant expression of FOLR1 in a subset of duct cells. The expression pattern of FOLR1 found in the single-cell RNA-Seq data was confirmed with immunofluorescence analysis of human pancreatic sections (gi). The white dashed line outlines the islet in (i). Arrowheads in g point to the subset of ductal cells expressing FOLR1, whereas essentially all ductal cells in the large duct in (h) are FOLR1+. Scale bars are indicated on the images. The staining pattern was consistent in pancreata from eight different donors.

EXPRESSION / LABELING:
Antibodies:
Fish:
Anatomical Term:
Stage: Day 6

One-carbon metabolism stimulates β-cell regeneration.

ae Single-plane confocal images of control (a), methotrexate-treated (b), Tg(actb2:folr1) (c) and Tg(actb2:folr1) cotreated with methotrexate (d) islets following 2 days of β-cell regeneration. Quantification showed that the number of regenerating β-cells upon Tg(actb2:folr1) overexpression was reduced to the baseline level after treatment with methotrexate (e). Scale bar, 10 μm. n = 14 control, n = 16 methotrexate-treated, n = 16 Tg(actb2:folr1), and n = 16 Tg(actb2:folr1) cotreated with methotrexate biologically independent zebrafish larvae were used for the quantification of β-cells. Data are presented as mean values ± SEM. One-way ANOVA was used to assess significance followed by Holm–Sidak’s multiple comparison test. *P = 0.0120. fi Folinic acid treatment for two days following β-cell ablation increased β-cell regeneration from ductal cells by 6 dpf in zebrafish larvae. Single-plane confocal images of Tg(ins:H2BGFP);Tg(ins:flag-NTR);Tg(tp1:H2BmCherry) control (f) and folinic acid-treated (g) larvae, along with the quantification of the β-cells (h) and the β-cells co-labeled with the ductal cell tracer tp1:H2BmCherry (i). Scale bar, 10 μm. n = 17 (control) and n = 15 (folinic acid) biologically independent zebrafish larvae were used for the quantification of this experiment. Data are presented as mean values ± SEM. Unpaired two-tailed Student’s t test was used for (h) **P = 0.0064. Unpaired two-tailed Student’s t-test was used to assess significance for (i) **P = 0.0094.

Folinic acid stimulates β-cell regeneration in juvenile zebrafish.

ad Single-plane and maximum projection confocal images of pancreata in control (aa”) or folinic acid-treated (bb”) 1-month-old juvenile zebrafish on the Tg(ins:H2BGFP);Tg(ins:flag-NTR);Tg(tp1:H2BmCherry) background, following β-cell ablation. Quantification showed an increase in the number of regenerating β-cells in the secondary islets upon treatment with folinic acid (c) as well as an increase in the number of ins:H2BGFP+tp1:H2BmCherry+ cells (d). The dashed line outlines the pancreas. Arrowheads point to ins:H2BGFP+ cells in the secondary islets. Scale bar, 20 μm. n = 8 (control) and n = 9 (folinic acid) biologically independent zebrafish were used for the quantification of this experiment. Data are presented as mean values ± SEM. Unpaired two-tailed Student’s t test was used to assess significance for (c) and (d). c *P = 0.0264; d *P = 0.0319.

Metabolomics characterization of folinic acid-treated zebrafish larvae following β-cell ablation.

a, b Heat-maps showing the significantly decreased (a) and increased (b) metabolites upon folinic acid treatment for 24 h, following β-cell ablation in the Tg(ins:flag-NTR) line. ce Changes in the level of folinic acid (c), folate (d), and 5-methylTHF (e) reported as fold change to the untreated zebrafish larvae after β-cell ablation following 24 h of folinic acid treatment. n = 6 (control) and n = 5 (folinic acid) biologically independent metabolite preparations from five pooled larvae each were used for the quantification of this experiment. Data are presented as mean values ± SEM. Mann–Whitney two-tailed test was used to assess statistical significance. c **P = 0.0043. fh Folinic acid treatment does not affect the levels of SAM (f), SAH (g), or their ratio (h). n = 6 (control) and n = 5 (folinic acid) biologically independent metabolite preparations from five pooled larvae each were used for the quantification of this experiment. Data are presented as mean values ± SEM. i Pathway impact values of zebrafish-specific enriched pathways for the significantly affected metabolites (Fig. 6a, b).

Folinic acid stimulates β-cell differentiation in neonatal pig islets.

ad Folinic acid stimulates β-cell differentiation from ductal cells in neonatal pig islets. Images of control (a) and folinic acid-treated (b) neonatal pig islets immunostained for insulin and CK7. Quantification of the percentage of CK7+ and CK7+Insulin+ cells is shown in (c) and (d), respectively. Arrowheads point to CK7+Insulin+ cells. n = 4 biologically independent pig islet preparations. Data are presented as mean values ± SEM. d *P = 0.0286. eh Folinic acid did not increase the percentage of α- or β-cells in the in vitro neonatal pig islet culture. Control (e) and folinic acid-treated (f) neonatal pig islets immunostained for insulin and glucagon. Quantification of the percentage of α- and β-cells is shown in (g) and (h), respectively. n = 4 biologically independent pig islet preparations. Data are presented as mean values ± SEM. The scale bar is 50 μm for all pictures in the figure. All statistical analyses were performed with a Mann–Whitney two-tailed test.

Acknowledgments
This image is the copyrighted work of the attributed author or publisher, and ZFIN has permission only to display this image to its users. Additional permissions should be obtained from the applicable author or publisher of the image. Full text @ Nat. Commun.