FIGURE SUMMARY
Title

Drug screening with zebrafish visual behavior identifies carvedilol as a potential treatment for an autosomal dominant form of retinitis pigmentosa

Authors
Ganzen, L., Ko, M.J., Zhang, M., Xie, R., Chen, Y., Zhang, L., James, R., Mumm, J., van Rijn, R.M., Zhong, W., Pang, C.P., Zhang, M., Tsujikawa, M., Leung, Y.F.
Source
Full text @ Sci. Rep.

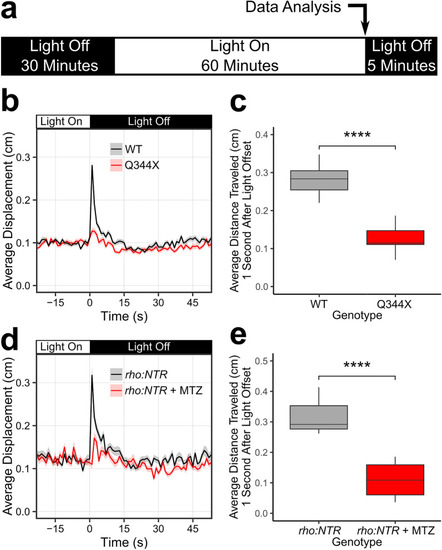
The Q344X larvae displayed a diminished scotopic light-off VMR driven by rods. (a) Schematic of the VMR protocol. On 7 dpf, larvae were habituated to the machine in darkness for 30 min. Then, the light stimulation was turned on and the plate was illuminated for 60 min. After that, the light was turned off. In this study, we mainly analyzed the VMR at light offset (light-off VMR) as indicated by the arrow. (b) The light-off VMR of wildtype (WT, black trace) and Q344X (red trace) larvae at 0.01 lx. The light was turned off at Time = 0. Each trace shows the average larval displacement of 18 biological replicates with 48 larvae per condition per replicate. The corresponding color ribbon indicates ± 1 standard error of the mean (s.e.m.). (c) Boxplot of the average larval displacement of WT and Q344X larvae one second after light offset. The average displacement of WT larvae (µ ± s.e.m.): 0.281 ± 0.036 cm, N = 18) was significantly larger than that of Q344X larvae (0.127 ± 0.031 cm, N = 18) (Welch’s Two Sample t-test, T = 13.2, df = 33.2, p value < 0.0001). To confirm this scotopic VMR was driven by rods, we chemically-ablated rods in larvae and subjected them to the same scotopic VMR assay (d, e). (d) The light-off VMR of larvae with nitroreductase-expressing rods treated with metronidazole (rho:NTR + MTZ, red trace) and without metronidazole (rho:NTR, black trace). Each trace shows the average displacement of 6 biological replicates with 24 larvae per condition per replicate. The corresponding color ribbon indicates ± 1 s.e.m. (e) Boxplot of the average displacement of rho:NTR and rho:NTR + MTZ larvae one second after light offset. The average displacement of untreated rho:NTR larvae (µ ± s.e.m.): 0.317 ± 0.061 cm, N = 6) was significantly larger than that of rho:NTR + MTZ larvae (0.110 ± 0.062 cm, N = 6) (Welch’s Two Sample t-test, T = 5.9, df = 10, p value < 0.0001).

Drug screening on the Q344X zebrafish identified carvedilol as a beneficial drug. (a) Carvedilol treatment on Q344X larvae resulted in a sustained scotopic light-off VMR (blue trace, N = 2 replicates of 24 larvae) compared to that of both DMSO-treated WT larvae and DMSO-treated Q344X larvae (black and red trace respectively, N = 9 replicates of 48 larvae in each group). Each trace shows the average displacement of each replicate, and the color ribbons indicate µ ± s.e.m. The two carvedilol replicates were highly consistent and not different from each other (High-Dimensional Nonparametric Multivariate Test, N = 24, THD = 1.78, p value = 0.91). Each replicate demonstrated a significant change in behavior for the duration of 30 s after light offset above DMSO-treated Q344X larvae (Hotelling’s T-squared test, N = 24, T = 378.0 and 456.0, df = 30, p value < 0.0001 for each replicate). (b) To determine if carvedilol’s effects are elicited through the retina, eyeless chokh fish were treated with carvedilol (blue trace) and their VMR was compared with untreated control (black trace). Carvedilol treatment did not increase the chokh VMR (Hotelling’s T-squared test, N = 24 larvae, T = 37.8, df = 30, p value = 0.946). (c) Q344X larvae were enucleated to determine if extraocular expression of Q344X RHO was causing the VMR seen with carvedilol treatment. Larvae were treated with carvedilol (blue trace) or DMSO (red trace) at 5 dpf and enucleated on the morning of 6 dpf. VMR was assessed at 7 dpf. Carvedilol showed no effect on enucleated Q344X larvae. (Hotelling’s T-squared test, N = 24 larvae, T = 28.8, df = 30, p value = 0.948). (d) Q344X larvae were treated with 100 μM adenylyl cyclase (ADCY) inhibitor SQ 22,536 (black trace) at 3 dpf to determine if inhibiting ADCY would improve the VMR compared to DMSO treatment (red trace). Treatment with SQ 22,563 significantly improve the Q344X VMR over DMSO treatment (Hotelling’s T-squared test, N = 3 replicates 24 larvae, T = 118, df = 30, p value < 0.0001).

Carvedilol treatment increased rod numbers in the Q344X larvae. Representative retinal cryosection of (a) a wildtype larva (WT), (b) a DMSO-treated Q344X larva, and (c) a carvedilol-treated Q344X (car) larva at 7 dpf. Rods were labeled by EGFP expression driven by rho promoter, and the nuclei were counterstained with DAPI. Scale = 50 μm. (d) Quantification of rod number in WT, DMSO-treated Q344X, and carvedilol-treated Q344X retinal cryosections from 5 to 7 dpf. There was a statistically significant difference in rod number between groups at all stages determined by one-way ANOVA at 5 dpf (WT, N = 11; Q344X, N = 16; F(1,25) = 71.04, p value < 0.0001), at 6 dpf (WT, N = 9; Q344X, N = 20; Q344X + car, N = 21 ; F(2,44) = 96.9, p value < 0.0001), and at 7 dpf (WT, N = 9; Q344X, N = 17; Q344X + car, N = 11; F(2,41) = 167.9, p value < 0.0001). The effect of Q344X rod degeneration and carvedilol treatment on rod number was assessed post hoc by pairwise t-test with false discovery rate correction at 6 dpf (WT − Q344X, p value < 0.0001; Q344X − Q344X + car, p value < 0.001) and at 7 dpf (WT − Q344X, p value < 0.0001; Q344X − Q344X + car, p value < 0.001). (e) Representative whole-eye images of WT, Q344X, and carvedilol-treated Q344X larvae at 7 dpf. Rods were labeled by EGFP expression. Left column: WT rods were mainly found on dorsal and ventral retina (top). They were abundantly present in the ventral patch of the retina extending medially (bottom). Middle column: Q344X rods were mostly degenerated at the same stage (top). There were only a handful of rods remaining near the lateral edge of the ventral patch in the Q344X retina (bottom). Right column: carvedilol treatment increased the number of Q344X rods on both dorsal and ventral retina (top); however, gaps of missing rods were still apparently on dorsal retina. More rods were observed in the ventral patch of the carvedilol-treated retina (bottom). Statistical analysis of whole-mount data is shown in Table 2. Scale = 100 μm. D dorsal, V ventral, M medial, L lateral.

Carvedilol treatment beginning at 3 dpf increased rod numbers in the Q344X larvae greater than the treatment beginning at 5 dpf. (a) Quantification of rod number in WT, Q344X treated with DMSO beginning at 3 dpf, and Q344X treated with carvedilol beginning at 3 dpf or 5 dpf. Rods were quantified from their retinal cryosections beginning at 3–7 dpf. There was no statistically significant difference in rod number between groups at 3 dpf and 4 dpf determined by one-way ANOVA (3 dpf; N = 10; F(3,36) = 0.1, p value = 0.95); (4 dpf; N = 10; F(3,36) = 0.5, p value = 0.69). There was a statistically significant difference in rod number between groups at 5 dpf through 7 dpf determined by one-way ANOVA (5 dpf, N = 10; F(3,36) = 0.1, p value < 0.0001), (6 dpf, N = 10; F(3,36) = 0.1, p value < 0.0001), (7 dpf, N = 10; F(3,36) = 0.1, p value < 0.0001). The effect of Q344X rod degeneration and carvedilol treatment on rod number was assessed post hoc by pairwise t-test with false discovery rate correction at 5 dpf (WT − Q344X, p value < 0.0001; Q344X − Q344X + car3dpf, p value < 0.001; Q344X − Q344X + car5dpf, p value = 0.36, Q344X + car3dpf − Q344X + car5dpf, p value < 0.0001), at 6 dpf (WT − Q344X, p value < 0.0001; Q344X − Q344X + car3dpf, p value < 0.0001; Q344X − Q344X + car5dpf, p value < 0.05; Q344X + car3dpf − Q344X + car5dpf, p value < 0.05), and at 7 dpf (WT − Q344X, p value < 0.0001; Q344X − Q344X + car3dpf, p value < 0.0001; Q344X − Q344X + car5dpf, p value < 0.05; Q344X + car3dpf − Q344X + car5dpf, p value < 0.05). (b) Carvedilol treatment of Q344X larvae beginning at 3 dpf (purple trace) displayed a significant scotopic light-off VMR when compared to Q344X larvae treated with DMSO (red trace) (Hotellings T-squared test, N = 3 replicates of 24 larvae, T = 397, df = 30, p value < 0.0001). Each trace shows the average displacement of each replicate, and the color ribbons indicate µ ± s.e.m.

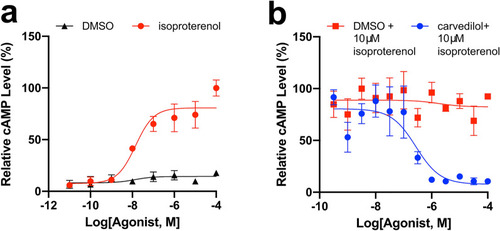
Carvedilol treatment might directly act on rods cells. To determine the extent to which carvedilol act directly on rods, we conducted a GloSensor cAMP assay with human Y79 cells. (a) Representative dose–response curves of GloSensor-transfected Y79 cells treated with half-log concentrations of isoproterenol (red trace; N = 4) or percentage-matched DMSO (black trace; N = 4). These plots were normalized to the maximum average luminescent level recorded per experiment. Error bars show ± 1 s.e.m. Isoproterenol was capable of increasing cAMP signaling through β-adrenergic receptor binding with an pEC50 of 7.49 ± 1.07. (b) Representative dose–response curves of GloSensor-transfected Y79 cells pretreated with half-log doses of carvedilol (blue trace; N = 4) or percentage-matched DMSO (red trace; N = 4). Cells were then challenged with a 10 μM isoproterenol that could induce maximal cAMP response, as shown in (a). Carvedilol pretreatment was capable of preventing isoproterenol-mediated cAMP increases with an pIC50 of 6.51 ± 0.67.

Acknowledgments
This image is the copyrighted work of the attributed author or publisher, and ZFIN has permission only to display this image to its users. Additional permissions should be obtained from the applicable author or publisher of the image. Full text @ Sci. Rep.