
- Title
-
foxm1 Modulates Cell Non-Autonomous Response in Zebrafish Skeletal Muscle Homeostasis
- Authors
- Ferreira, F.J., Carvalho, L., Logarinho, E., Bessa, J.
- Source
- Full text @ Cells
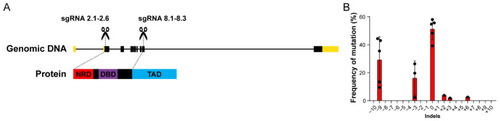
foxm1 CRISPR/Cas9-mediated disruption results in in-frame deletions. (A) The genomic sequence of foxm1 highlighting the 5′ and 3′ UTRs (yellow boxes), exons (black boxes) and regions targeted with CRISPR/Cas9. This strategy targets the NRD and the TAD domains. (B) Statistically significant deletions (p value < 0.05) detected at 24 hpf in batches of 8 embryos injected with sgRNA 8.2. Frequency reflects abundancy of WT and mutant alleles. n = 5. |
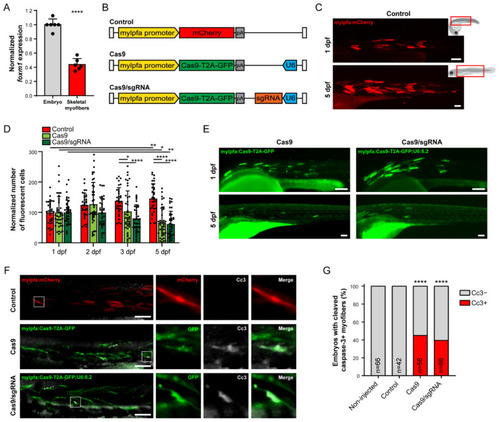
Skeletal muscle cell-specific targeting of foxm1 with CRISPR/Cas9 is detrimental. (A) Expression of foxm1 in whole zebrafish embryo (except skeletal myofibers) and FACS-sorted skeletal myofibers at 3 dpf. Values are mean ± SD from n = 6. **** = p < 0.0001 by Student’s t-test. (B) Representation of the Tol2 cassettes used for transgenesis in this study. White bar represents the Tol2 recombination sites, pA refers to the poly-A sequence and U6 refers to the ubiquitous U6 promoter. (C) Embryo injected with mylpfa:mCherry, at 1 (top) and 5 dpf (bottom). Fluorescence microscopy images correspond to the embryo areas indicated by red boxes on the right. (D) Quantification of mCherry-positive (Control) or the GFP-positive (Cas9 and Cas9/sgRNA) cells at 1, 2, 3 and 5 dpf. Values are mean ± SD from n ≥ 34 embryos, * = p < 0.05, ** = p < 0.01, **** = p < 0.0001 by one-way ANOVA with Bonferroni correction for multiple comparisons. (E) Embryo injected with mylfpa:Cas9-T2A-GFP (Cas9) and mylfpa:Cas9-T2A-GFP;U6:8.2 (Cas9/sgRNA), at 1 (top) and 5 dpf (bottom). (F) 2 dpf embryos injected with mylpfa:mCherry (Control), mylfpa:Cas9-T2A-GFP (Cas9) or mylfpa:Cas9-T2A-GFP;U6:8.2 (Cas9/sgRNA) stained with anti-cleaved caspase-3 (Cc3) antibody. (G) Quantification of 2 dpf embryos with Cc3-negative (Cc3−, gray) and Cc3-positive (Cc3+, red) myofibers from n ≥ 42 embryos per condition. **** p < 0.0001 by Fisher’s exact test using the discrete number of embryos per condition, comparison with control embryos. Scale bar: 100 µm. |

foxm1 in skeletal muscle cells contributes for non-autonomous signaling and tissue homeostasis. (A) mCherry-positive cells in embryos also injected with mylfpa:Cas9-T2A-GFP (Cas9) and mylfpa:Cas9-T2A-GFP;U6:8.2 (Cas9/sgRNA), at 1 and 5 dpf. (B) Quantification of mCherry-positive cells in control, Cas9 and Cas9/sgRNA embryos at 1, 2, 3 and 5 dpf. Values are mean ± SD from n ≥ 34 embryos per condition. ** p < 0.01, **** p < 0.0001 by one-way ANOVA with Bonferroni correction for multiple comparisons. (C) Illustration of a 3 dpf larva and the region used for Pax7 immunostaining quantitative analysis. Red dashed lines represent the quantified cells in the central myotome and the vertical and horizontal myosepta. (D) Embryos of 3 dpf injected with mylfpa:Cas9-T2A-GFP (Cas9) or mylfpa:Cas9-T2A-GFP;U6:8.2 (Cas9/sgRNA) stained with anti-Pax7 antibody and DAPI. (E) Quantification of Pax7-positive cells per somite in 3 dpf embryos. Values are mean ± SD, from n = 13 embryos per condition. * = p < 0.05 by a Student’s t-test. Scale bar: 100 µm. |