FIGURE SUMMARY
Title

Edelfosine nanoemulsions inhibit tumor growth of triple negative breast cancer in zebrafish xenograft model

Authors
Saraiva, S.M., Gutiérrez-Lovera, C., Martínez-Val, J., Lores, S., Bouzo, B.L., Díez-Villares, S., Alijas, S., Pensado-López, A., Vázquez-Ríos, A.J., Sánchez, L., de la Fuente, M.
Source
Full text @ Sci. Rep.

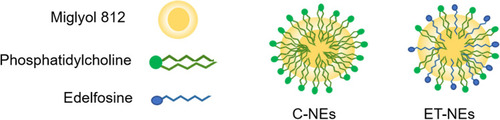
Schematic representation of control (C-NEs) and edelfosine (ET-NEs) nanosystems.

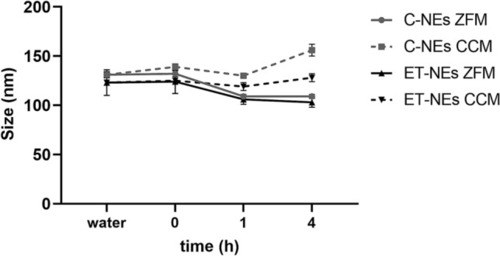
Stability of control NEs (C-NEs) and edelfosine NEs (ET-NEs) upon incubation with zebrafish medium (ZFM, sterile dechlorinated tap water) and cell culture medium (CCM, DMEM supplemented with 1% FBS) for 0, 1 and 4 h, at 37 °C.

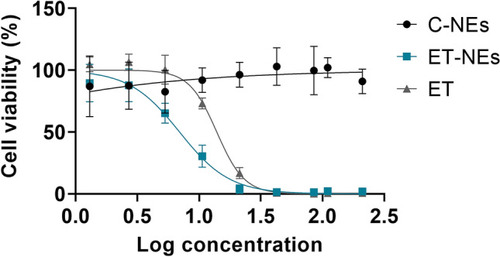
MDA-MB-231 cell viability upon the treatment with increasing concentrations of free edelfosine (ET) edelfosine nanoemulsions (ET-NEs) and control nanoemulsions (C-NEs) during 24 h at 37 °C.

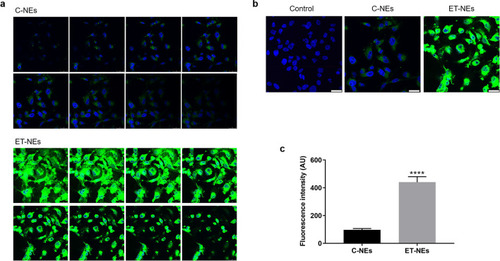
Internalization of NEs in MDA-MB 231 cells. (a) Gallery of confocal microscopy images of MDA-MB 231 cells incubated with 150 µg/mL of C-NEs and ET-NEs labeled with TopFluor-PC (green channel) for 4 h at 37 ºC. (b) Representative confocal microscopy single-plan image of control vs C-NEs and ET-NEs internalization by MDA-MB 231 cells. (c) Fluorescence intensity (AU, arbitrary units) of two maximum projection images (resultant from the combination of all the sections shown in (a)) was determined using ImageJ software. Statistical analysis was performed using t test. P value ****p < 0.0001. Cell nuclei was stained with Hoechst (blue channel). Scale bars correspond to 25 µm.

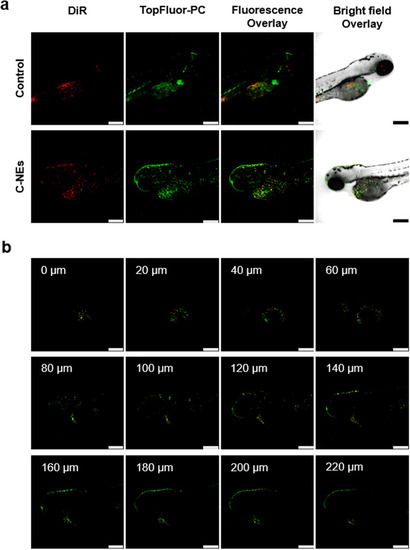
Confocal microscopy images of 72 hpf zebrafish embryos (a) incubated with 500 µg/mL of C-NEs labeled with DiR and TopFluor-PC, for 4 h at 34 °C. Control refers to non-treated zebrafish, which present auto-fluorescence. Scale bars correspond to 250 µm. (b) Z-stack images. Red channel: DiR. Green channel: TopFluor-PC.

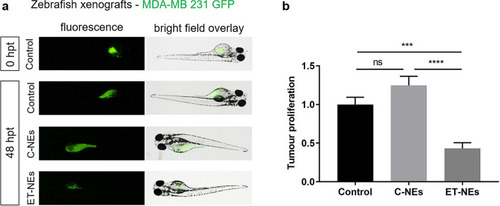
Confocal analysis of tumor cell proliferation in zebrafish (a) before (0 hpt) and after 48 hpt. Zebrafish of 48 hpt without chorion were injected with MDA-MB 231 cells expressing GFP and subsequently incubated with ET-NEs and C-NEs at 34 °C. Untreated xenografted embryos were used as control. (b) QuantiFish analysis program was used to quantify the fluorescence intensity and determine tumor proliferation. Statistical analysis was performed using One-way ANOVA followed by a Tukey test. P values ***p < 0.001, ****p < 0.0001, ns, not significant.

Acknowledgments
This image is the copyrighted work of the attributed author or publisher, and ZFIN has permission only to display this image to its users. Additional permissions should be obtained from the applicable author or publisher of the image. Full text @ Sci. Rep.