
IMAGE
Figure 6
- ID
- ZDB-IMAGE-210518-33
- Publication
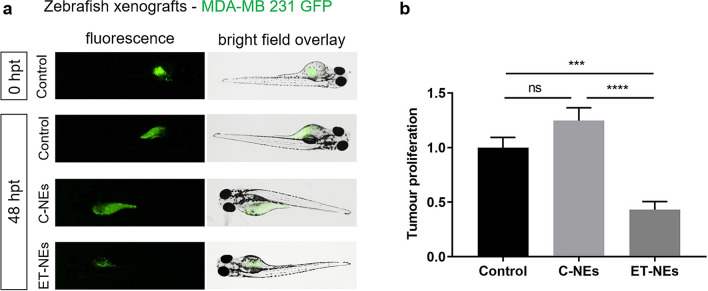
- Saraiva et al., 2021 - Edelfosine nanoemulsions inhibit tumor growth of triple negative breast cancer in zebrafish xenograft model
- All Figures
- Figures for Saraiva et al., 2021
Image
|
Figure Caption
Figure 6
Confocal analysis of tumor cell proliferation in zebrafish (
Acknowledgments
This image is the copyrighted work of the attributed author or publisher, and
ZFIN has permission only to display this image to its users.
Additional permissions should be obtained from the applicable author or publisher of the image.
Full text @ Sci. Rep.