
- Title
-
Dihydrotanshinone I inhibits ovarian cancer cell proliferation and migration by transcriptional repression of PIK3CA gene
- Authors
- Wang, X., Xu, X., Jiang, G., Zhang, C., Liu, L., Kang, J., Wang, J., Owusu, L., Zhou, L., Zhang, L., Li, W.
- Source
- Full text @ J. Cell. Mol. Med.

Dihydrotanshinone I selectively attenuates proliferation of SOC cells but not normal ovarian epithelial cells. A, IC50 of four compounds of the tanshinone family in human ovarian cancer cell line A2780. Ovarian cancer cells were treated with various concentrations of DHTS, tanshinone IIA, tanshinone I and cryptotanshinone for 48 h. Then, cell viability was determined by MTT assay. B, Anti‐proliferative effect of DHTS in IOSE80, A2780 and OV2008 cells by MTT assay. Cell lines were treated with various concentrations of DHTS (0, 1, 2, 4, 6, 8 and 10 μM) for 24 h or 48 h. Data represent means ± SEM of triplicate samples. * |
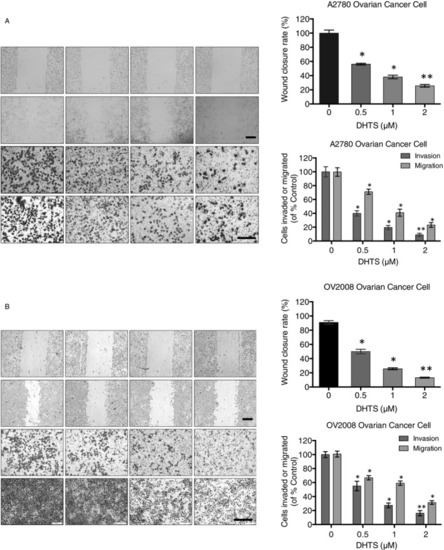
DHTS suppresses migration and invasion in A2780 and OV2008 ovarian cancer cells. (A, B) Effect of DHTS treatment on migration and invasion in A2780 and OV2008 ovarian cancer cells. Cancer cells were treated with different concentrations of DHTS (0, 0.5, 1 and 2 μM) for 24 h, followed by wound‐healing assay (top) and transwell chamber migration and invasion assays (bottom). Bar scale = 200 μm, * |
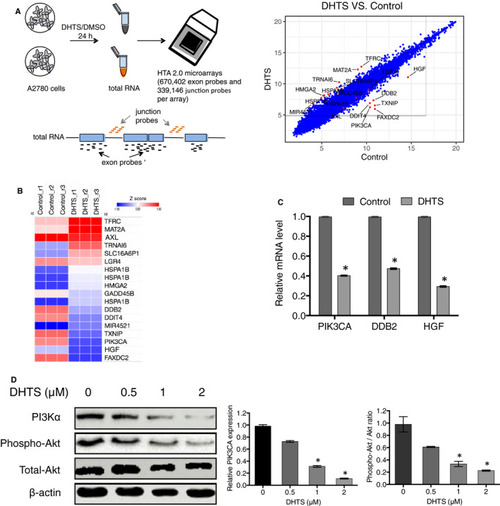
Critical role of PI3K/AKT signalling pathway in DHTS induced A2780 ovarian cancer cell death. A, Scatter plot comparing global gene expression profiles in DHTS‐treated and DMSO‐treated A2780 ovarian cancer cells. Each dot presented on the graph corresponds to one transcript. A2780 cells were treated with DHTS (2 μM) or DMSO (Control) for 24 h, followed by total RNA isolation and Affymetrix HTA 2.0 array. B, Heat map of differentially expressed genes found in DHTS‐treated vs. DMSO‐treated A2780 cells. C, mRNA expression levels of PIK3CA, DDB2 and HGF detected by real‐time PCR. A2780 cells were treated with DHTS (2 μM) or DMSO for 24 h, followed by mRNA isolation and real‐time PCR. D, Regulation of PI3K/AKT signalling pathway in A2780 ovarian cancer cells treated with DHTS. Western blotting was performed to determine the expression or phosphorylation of PI3Kα, p‐AKT and AKT in A2780 cells treated with DHTS (0, 0.5, 1 and 2 μM) for 48 h. * |

Overexpression of PIK3CA increases the viability and colony formation of DHTS‐treated A2780 ovarian cancer cells. A, Ectopic expression of PIK3CA in A2780 cells. PIK3CA expression level of A2780 cells that was transfected with an empty vector (Vector) or with a vector encoding PIK3CA (PIK3CA‐OX) was detected by real‐time PCR and Western blotting. B, Effect of PIK3CA overexpression on proliferation in DHTS‐treated A2780 cells after indicated plasmid transfection by MTT assay. Cells were treated with various concentrations of DHTS (0, 2, 4, 6 and 8 μM) for 24 h. C, Colony formation of A2780 cells stably expressing indicated plasmids. Cancer cells were treated with DHTS (2 μM) for 48 h and in vitro cultured for another 2 weeks for colony forming. The surviving colonies were stained with crystal violet and counted with ImageJ (colony counter). Data represent means ± SEM of triplicate samples. * |
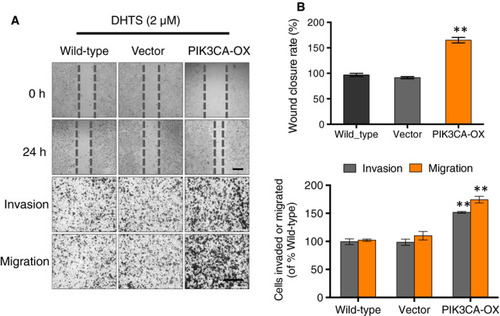
Overexpression of PIK3CA gene increases cell migration and invasion of DHTS-treated A2780 ovarian cancer cells. (A, B) Effect of PIK3CA overexpression on migration and invasion in DHTS-treated A2780 cells after indicated plasmid transfection by wound-healing assay (top) and transwell chamber migration and invasion assays (bottom). Cells were treated with DHTS (2 μM) for 24 h. Bar scale = 200 μm, **P < .01 vs. untreated control |

DHTS sensitizes A2780 ovarian cancer cells to cisplatin by inducing DNA damage. (A) Anti‐proliferative effect of different compounds in A2780 cells by MTT assay. Cell lines were treated with DMSO (control), DHTS (2 μM), cisplatin (6 μM) or a combination of DHTS and cisplatin for 48 h. (B) Levels of cellular γH2AX foci in A2780 cancer cells by immunofluorescence. A2780 cells were treated with different agents for 24 h, followed by γ‐H2AX antibody staining. Bar scale = 50 μm, * |

Inhibition of tumour growth and metastasis by DHTS in zebrafish cancer model. A, Effect of DHTS and cisplatin on tumour growth and metastasis in zebrafish xenografts. Cancer‐bearing zebrafish embryos were treated with DHTS (0.5 and 1 μmol/L) or cisplatin (50 μmol/L). Arrowheads indicate metastatic tumour cells in the distal parts of the fish body (Bar scale = 500 μm). B, Quantification of tumour volume (n = 10/group). c Averages of maximal distances of metastatic foci (n = 10/group). Data represent means ± SEM. ** |