FIGURE SUMMARY
Title

Giantin is required for intracellular N-terminal processing of type I procollagen

Authors
Stevenson, N.L., Bergen, D.J.M., Lu, Y., Prada-Sanchez, M.E., Kadler, K.E., Hammond, C.L., Stephens, D.J.
Source
Full text @ J. Cell Biol.

Fracture defects in golgb1 mutant zebrafish. (A) Quantification of the number of fractures naturally found in the caudal fin of WT and golgb1X3078/X3078 heterozygous and HOM mutant fish at 7 mo old. Data show percentage of fish with × number of fractures (WT = 12 fish, HET = 11 fish, HOM = 25 fish from two independent crosses). Statistics performed with a Mann-Whitney U test. (B) Fluorescence images of naturally occurring caudal fin defects in golgb1X3078/X3078 fish stained with ARS. White arrows indicate fractures. Scale bar = 200 µm. (C and D) Quantification (C) and representative brightfield and fluorescent images (D) of experimentally induced fractures in golgb1wt/wt and golgb1X3078/X3078 caudal fins on different dpi. Bone was stained with calcein at each time point before imaging. (C) Calcein intensity in fractures was measured relative to that of healthy adjacent bones. Lower exposure images than those in D were used for quantification to avoid saturation. Each dot represents one fracture. Bars show median and interquartile range (two fish per line quantified, each with three fractures). (D) Proximal end of bone is at the top of image. Scale bar = 200 µm. (E) Representative brightfield and fluorescent images of experimentally induced fractures in the caudal fin of golgb1wt/X3078 and golgb1X3078/X3078 fish expressing a col1a1a:GFP promoter reporter at different time points. Proximal end of bone is at the top of image. Scale bar = 200 µm. (F) Quantification of col1a1a:GFP signal at the fracture site relative to an adjacent healthy bone. Each dot represents one fracture. Orange bars indicate median and interquartile range. At time points 4 and 7 dpf, 11 fish per line were quantified. At time points 14 and 21 dpf, n = 6 HETs and n = 4 HOM fish quantified. All data were collected in a single experiment. All P values were calculated with the Mann-Whitney U test comparing the means for each fish, three fractures per fish. A.U, arbitrary units.

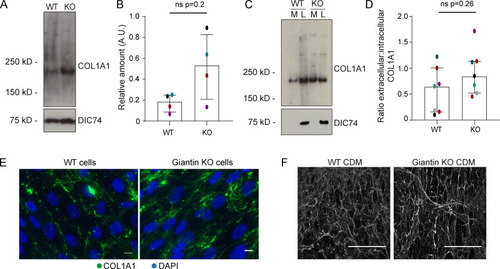
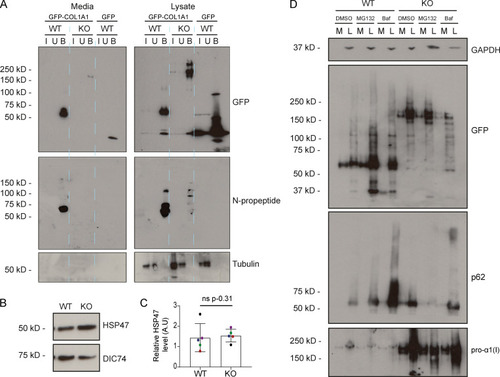
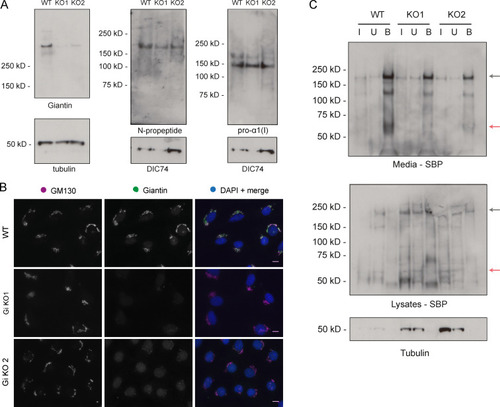
(A) Immunoblot of pro-α1(I) and dynein intermediate chain (DIC74, housekeeping) in cell lysates taken from WT and giantin KO cells. (B) Densitometry of the semiquantitative ECL immunoblots represented in A. Dots show individual replicates, and each independent experiment is color coded between cell lines. Bars depict median intensity of pro-α1(I) (COL1A1) normalized against DIC74 (n = 4 biological replicates). Error bars = interquartile range. Statistical test: Mann-Whitney U test. (C) Immunoblot of media (M) and cell lysate (L) fractions taken from WT and giantin KO cell cultures after 16-h incubation with serum-free medium plus 50 µg/µl ascorbate. (D) Ratio of extracellular versus intracellular levels of collagen as measured from secretion assays represented in C. pro-α1(I) (COL1A1) levels measured by densitometry from semiquantitative enhanced chemiluminescent blots and normalized against DIC74 before calculating ratios. Dots show individual replicates, and each independent experiment is color coded between cell lines. Bars depict median and interquartile range (n = 7 biological replicates). Statistical test: Mann-Whitney U test. (E) Maximum projections of widefield image stacks showing PFA fixed, unpermeabilized cells immunolabeled for endogenous pro-α1(I) (COL1A1, green). Nuclei are stained with DAPI (blue). Scale bars = 10 µm. (F) The cell-derived matrix produced by WT and giantin KO cells imaged as tilescans of confocal z-stacks of antibody-labeled pro-α1(I) presented as maximum projections. Scale bars = 2 µm (E) and 100 µm (F). A.U., arbitrary units.

ER-Golgi trafficking of pro-α1(I) is unperturbed in giantin KO RPE1 cells. (A) Schematic of the pro-SBP-GFP-COL1A1 construct used in this study. SS, signal peptide. (B and C) Single-plane confocal stills taken from live imaging movies of a WT (B) and giantin KO (C) cell stably expressing GFP-COL1A1 (green) and transiently transfected with mCh-ST (magenta) and an ER RUSH hook. Frame times in the top left corner indicate the time (minutes) after biotin addition, which releases GFP-COL1A1 from the ER hook. Scale bars = 10 µm on overview and 1 µm on zoom. White arrows indicate the appearance of peripheral GFP-COL1A1 punctate. Orange arrows indicate emerging post-Golgi carriers. See also videos. (D) Quantification of the time taken for GFP-COL1A1 to first appear at the Golgi in videos represented in B and C. Each dot represents one cell (16 WT cells and 13 giantin KO cells), and videos were collected over seven independent experiments. Bars represent median and interquartile range. Results are not significant using a Mann-Whitney U test. (E) Maximum projections of confocal z-stacks of WT and giantin KO cells imaged live as in B and C and then fixed with PFA as soon as the GFP-COL1A1 appeared around the Golgi. Cells were then immunolabeled for the Golgi marker GM130 (blue). Scale bars = 10 µm.

Procollagen processing is defective in giantin KO RPE1 cells. (A) Representative images of WT and giantin KO cells expressing GFP-COL1A1 or GFP alone as indicated and immunolabeled for pro-α1(I) (COL1A1, magenta). Cells are not expressing a RUSH hook. Nuclei are stained with DAPI (blue). Images are maximum-intensity projections of widefield z-stacks. Scale bars = 10 µm. (B–F) Immunoblots of secretion assays showing the medium (M) and lysate (L) fractions of WT and giantin KO cell cultures immunoblotted for GFP and tubulin (B), SBP and tubulin (C), pro-α1(I) C-propeptide (LF41 antibody) and tubulin (D), pro-α1(I) N-propeptide (LF39 antibody; E), and pro-α1(I) and GAPDH (F). Black arrows indicate full-length procollagen, and red arrows highlight N-propeptide bands. (G) Maximum-intensity projection widefield z-stacks of WT and giantin KO cells stably expressing GFP-COL1A1 immunolabeled for the pro-α1(I) N-propeptide (LF39 antibody). Scale bars = 10 µm. Ab, antibody.

Intracellular procollagen processing in RPE1 cells. (A) Immunoblots of WT RPE1 cells stably expressing GFP-COL1A1 that were exposed to trypsin for the indicated amount of time before lysis. Lanes 2 and 8 contain lysates from cells that were treated with trypsin + an equal volume of soybean trypsin inhibitor as a negative control. Samples in lanes 1–6 were treated with digitonin for 2 min before trypsin treatment to permeabilize the cells. The DIC74, HSP47, and EGFR blots shown are all from a single membrane, but the scan images were digitally cut in half and the halves swapped to align the correct lanes with the ±digitonin labels in the figure. (B) Immunoblots of secretion assays performed on WT RPE1 cells incubated at 20°C or 37°C overnight in the presence of ascorbate. Prior to overnight incubation, cells were treated with cycloheximide (CHX) and ascorbate to flush through pre-existing procollagen. Lane 7 contains a lysate sample taken at the end of this cycloheximide treatment to show the extent to which this removed the procollagen. Lane 1 and 2 samples show media (M) and lysate (L) fractions of a cell culture treated with ascorbate only without the cycloheximide. (C) Single-plane widefield images of cells subjected to the experimental conditions of B but fixed after overnight incubation at 20°C or 37°C in the presence of ascorbate. Cells were stained by immunofluoresence for GM130 (magenta) to label the Golgi and DAPI stained (blue) to show the nuclei. Scale bars = 10 µm.

Validation of processing defects in other giantin mutant RPE1 lines. (A) Immunoblot of lystates from WT and giantin exon 13 KO RPE1 clones probed for giantin (polyclonal against full-length protein) and tubulin (housekeeping). (B) Widefield maximum-projection images of WT and giantin KO RPE1 cell clones immunolabeled for the N-terminus (N-term) of, and full-length (FL) giantin; ER exit sites (Sec31); and the Golgi (GRASP65) as indicated. Scale bar = 10 µm. (C) Immunoblots of secretion assays performed on WT and giantin KO clones stably expressing GFP-COL1A1 and untransfected giantin KO cells (unTF). Blots show the medium (M) and lysate (L) fractions of each cell population immunoblotted for GFP, SBP, and pro-α1(I) N-propeptide as indicated. (D) Maximum-projection widefield images of GFP signal in giantin KO clones stably expressing GFP-COL1A1 and immunolabeled for pro-α1(I) N-propeptide (magenta). Scale bar = 10 µm.

Fracture analysis in WT and mutant zebrafish. (A and B) Quantification of the intensity of ARS (A) and callous width of experimentally induced fractures (B) normalized to adjacent healthy bone at different time points after injury (D = days after injury) in golgb1wt/X3078 and golgb1X3078/X3078 fish. Dots represent individual fractures. At time points 4 and 7 dpf, 11 fish per line were quantified. At time points 14 and 21 dpf, n = 6 HETs and n = 4 HOM fish. All from a single experiment. Horizontal and vertical orange lines depict median and interquartile range, respectively. No significant differences based on P values calculated with a Mann-Whitney U test comparing the mean value per fish (three fractures per fish). (C) Immunoblots of caudal fin lysates collected from 13-mo-old golgb1+/−;col1a1a:GFP+ and golgb1−/−;col1a1a:GFP+ fish blotted for pro-α1(I). (D and E) Immunoblots with a pro-α1(I) antibody (D) and a Coomassie-stained gel of lysates (E) taken from the regenerated fin of the fish 5 d after initial amputation. (D) Each lane shows one representative individual. (E) Each lane contains sample from a different individual. (F and G) An immunoblot probed with pro-α1(I) (F) and a Coomassie-stained gel of lysates (G) taken from golgb1+/−;col1a1a:GFP+ and golgb1−/−;col1a1a:GFP+ larvae at 5 dpf. Each sample consists of 20 pooled larvae. (H and I) TEM images of collagen fibrils taken at the outer edge of the hemiray bone (H) and basement membrane in the skin (I) of regenerated caudal fins fixed 7 dpi. Fish were 8 mo old at the point of assay. Two females and two males were assayed. All TEM scale bars = 500 nm. A.U, arbitrary units.

Procollagen processing controls. (A) Immunoblot of a GFP trap of media and lysate fractions of WT and giantin KO RPE1 cell cultures. Cells were either expressing GFP-COL1A1 or GFP alone as indicated. Blots show the input (I), unbound (U), and bound (B) fractions of the IP immunoblotted for GFP, pro-α1(I) N-propeptide (LF39 antibody), and tubulin (housekeeping). (B) Immunoblot of HSP47 and DIC74 (housekeeping) in WT and giantin KO RPE1 cell lysates. (C) Densitometry of the semiquantitative enhanced chemiluminescent immunoblots represented in A. HSP47 levels are normalized to DIC74. Each dot represents an independent biological replicate, and replicates are color coded between cell lines. Bars show median and interquartile range (n = 5 biological replicates). P value calculated with a Mann-Whitney U test. (D) Immunoblots of media (M) and lysate (L) fractions of WT and giantin KO RPE1 cell cultures stably expressing GFP-COL1A1 following treatment with DMSO (vehicle control), MG132, or bafilomycin (Baf). Blots are probed for GAPDH (housekeeping), GFP (GFP-COL1A1), p62 (positive control for bafilomycin), and pro-α1(I) (COL1A1) as indicated. A.U, arbitrary units.

Validating pro-α1(I) processing defect in other giantin KO clones. (A and B) Genomic DNA sequence and amino acid translation at CRISPR/Cas9 mutation site in three new giantin KO clones targeted at exon 13 (A) and two new MC3T3 mutants targeted at exon 8 (B). On the WT sequences, the gRNA sequence is indicated with a purple line, the cut site is indicated by scissors, and the PAM site is in blue text. In mutant sequences, red text indicates inserted base pairs in genomic sequence, and green text shows altered amino acids. Asterisks denote premature stop codons.

Procollagen processing in giantin KO MC3T3 cells. (A) Immunoblots of cell lysates taken from WT and giantin KO MC3T3 cells. Antibodies used are as indicated. (B) Single-plane widefield images of WT and giantin KO MC3T3 cells immunolabeled for giantin (green) and the cis-Golgi marker GM130 (magenta). The nucleus is stained in DAPI. Scale bar = 10 µm. (C) Immunoblots of a GFP trap of WT and giantin KO MC3T3 cell cultures transiently expressing GFP-COL1A1. Media and lysates were assayed after 24 h of ascorbate treatment, which was conducted 24 h after transfection. The input (I), unbound (U), and bound (B) fraction of each pull-down is shown probed with either SBP or tubulin antibodies as indicated underneath each blot. Black arrows indicate full-length procollagen, and red arrows the N-propeptide.

Acknowledgments
This image is the copyrighted work of the attributed author or publisher, and ZFIN has permission only to display this image to its users. Additional permissions should be obtained from the applicable author or publisher of the image. Full text @ J. Cell Biol.