
- Title
-
Mechanical control of tissue shape and morphogenetic flows during vertebrate body axis elongation
- Authors
- Banavar, S.P., Carn, E.K., Rowghanian, P., Stooke-Vaughan, G., Kim, S., Campàs, O.
- Source
- Full text @ Sci. Rep.

Fluid-to-solid tissue transition during zebrafish posterior axis elongation. (a), Schematic lateral view of the zebrafish embryo at 10-somite stage, showing the previously reported2 fluid-like mesodermal progenitor zone (MPZ) and solid-like presomitic mesoderm (PSM). (b), Cells from dorsal-medial (DM) tissues (green arrow) enter the ventral MPZ tissue at the posterior end (lateral view). The tissue undergoes a fluid-to-solid transition along the AP axis, as cells from the fluid-like MPZ mature and join the solid-like PSM. (c), Sketch of a dorsal view of ventral tissues showing both the fluid-to-solid tissue transition and the entrance of cells from the DM into the MPZ. (d–e), Spatial profiles of the rate of cell (material) addition to ventral tissues, Q(x) (d), and tissue viscosity, 𝜇(𝑥) (e), used in the simulations. |

Morphogenesis of posterior tissues. (a), Time evolution of posterior tissue shape from an initial semi-circular shape (gray), as 𝜎C/𝑃𝐶 and 𝜎A/𝑃𝐶 are varied (𝜎A/𝜎P=10, 𝜆𝜇/𝜆𝑄=2). Four time snapshots at 𝑡/𝜏=10,25,50,75 (blue, green, orange and red, respectively) are shown for each parameter combination. The dotted lines qualitatively separate different regimes: isotropic expansion (IE), intermediate regime (IR), and unidirectional elongation (UE). The diffuse violet color indicates the estimated parameter region for wild type zebrafish body axis elongation. (b–c) A sharp increase in capillary stress during unidirectional elongation (arrow in a), leads to an increase of tissue pressure (b) that prevents addition of material from dorsal tissues into the MPZ (b; vanishing Q), halting tissue flows (b; vanishing velocities) and arresting further tissue elongation (c). |

Distinct types of tissue dynamics during posterior body morphogenesis. (a–c), Tissue pressure and velocity field associated to morphogenetic flows for the three limiting regimes shown in Fig. 2a, namely isotropic expansion (IE; a), intermediate regime (IR; b) and unidirectional elongation (UE (nv); c). The parameter values for each of these cases are those indicated in Fig. 2a for each regime. The pressure and velocity fields during unidirectional tissue elongation are qualitatively different from those obtained during isotropic expansion and in the intermediate regime. The left column shows the input fields of the simulations, namely the tissue viscosity, 𝜇(𝑥), and the addition of new tissue material, Q(x, y), at the same time point as the pressure and velocity fields. |

Morphogenetic flows and stress field during unidirectional elongation of the body axis. (a,b), Velocity field and streamlines of morphogenetic flows for different values of 𝜎C/𝑃𝐶, showing two structurally different flow fields (a). For large capillary stresses 𝜎C, the flow emerges from a single topological defect (a; source) of charge +1 (b). For lower capillary stresses, the tissue flow dramatically changes its structure and is characterized by three topological defects, namely 2 counter-rotating vortices (each with charge +1) and a stagnation point associated with hyperbolic flow (with charge −1). The remaining parameter values for each case are those indicated in Fig. 2a for unidirectional elongation (UE) in the absence and presence of vortices, labelled nv (no vortices) and v (vortices), respectively. (c), Diagram indicating the structure (presence or absence of vortices) of tissue flows. The tissue morphogenetic flows sharply transit from the two flow structures shown in (a) as the parameters are changed. The diffuse violet color indicates the estimated parameter region for wild type zebrafish body axis elongation. (d–g), Spatial distribution of all components of the stress tensor, namely the AP axial stress 𝜎𝑥𝑥 (d), the mediolateral stress 𝜎𝑦𝑦 (e) and the shear stress 𝜎𝑥𝑦 (f), as well as the tissue pressure P (g), for the two examples of tissue flows shown in panel (a). Despite the dramatically different structures of the flow field, the stresses are very similar. Both the location of the fluid-to-solid transition and the size of the region where cells enter ventral tissues are indicated by gray dashed lines at distances 𝜆𝜇 and 𝜆𝑄, respectively, from the posterior body end. |
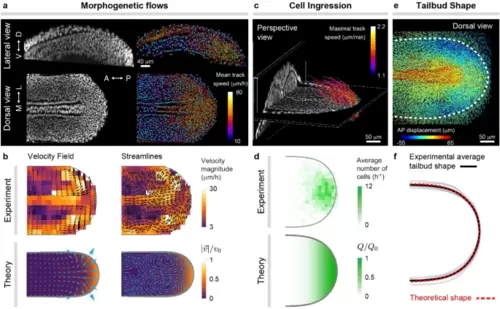
Morphogenetic flows and tissue shape during zebrafish posterior body axis elongation. (a), Confocal lateral and dorsal sections of nuclei (gray) in posterior tissues of a zebrafish embryo at the 10 somite stage (left). Results of nuclear (cell) tracking showing a subset of identified nuclei (blue) and associated tracks (trajectories), color-coded according to their mean speed. (b), Experimentally measured and theoretically obtained velocity field and streamlines of the morphogenetic flows in ventral tissues. (c), Perspective 3D view of a confocal stack through elongating posterior tissues, showing a D–V section at the boundary between dorsal and ventral tissues and a AP section far from the posterior end. Tracks of cells entering ventral tissues from DM tissues are shown and color-coded according to their maximal speed. (d), Measured frequency map of cells entering the MPZ from DM tissues and theoretically assumed spatial distribution of the same quantity, namely Q(x, y). (e), Dorsal view of cell (nuclear) trajectories in posterior tissues, color-coded according to the magnitude of their AP displacement. The boundary of ventral tissues is shown as a thick dashed line and determines the shape of the elongating posterior body. (f), Comparison of experimentally measured and theoretically predicted shapes of the posterior elongating tissue. The simulation results in (b,d,f) are all for the same parameters (𝜆𝜇/𝜆𝑄=1.5, 𝜎A/𝑃C=0.1, 𝜎P/𝑃C=0.02, 𝜎C/𝑃C=0.0001). |