FIGURE SUMMARY
Title

Delay in primordial germ cell migration in adamts9 knockout zebrafish

Authors
Carver, J.J., He, Y., Zhu, Y.
Source
Full text @ Sci. Rep.

Conserved structure of Adamts9 from C. elegans to human. Different function domains are illustrated in different color. Green triangles show sites for two commercial antibodies (Triple Point Biologics, Inc., OR) generated against 180 peptide sequence of prodomain and metalloproteinase domain of human Adamts9, which share 41% and 86% sequence identity with zebrafish Adamts9, respectively. Red triangle shows CRISPR targeting site for generating zebrafish adamts9 knockout. Two mutant zebrafish lines (∆10 and ∆11) which generated premature stop codons before the enzymatic active site (at 573aa) were selected and propagated24 (Please see supplemental Figs. 1 and 2, Supplemental Tables 14 for detail).

Strong adamts9 expression in preovulatory follicular cells and developing embryos. (A) Expression of adamts9 determined by RT-PCR. Top panel is adamts9 transcript analyzed by RT-PCR (35 cycles), bottom panel is expression of a house keep gene, eukaryotic translation elongation factor 1 alpha 1a (eef1a1a). M. NEB 1 kb plus DNA ladder; 1. Ovary (fully grown immature follicles); 2. Preovulatory stage IVb follicles; 3. Ovulated stage V oocytes; 4. One cell stage embryos; 5. Four cell stage embryos; 6. Oblong stage embryos (~ 3.5 hpf, hours post fertilization); 7. Germ-ring stage embryos (~ 5.5 hpf); 8. Eight somite stage embryos (~ 11.5 hpf); 9. 24 hpf (hours post fertilization) embryos; 10. Two dpf (days post fertilization ) embryos; 11. Three dpf embryos; 12. Six dpf embryos; 13. Six wpf (weeks post fertilization) gonad. Please see Supplemental Figs. 3 and 4 for full agarose gel images. (B) Strong adamts9 expression in preovulatory follicles, low or no expression in immature follicles or ovulated oocytes determined by real-time quantitative PCR (qPCR). Stage I and III immature follicles,  IVb preovulatory follicular cell enclosed oocytes and stage V ovulated oocytes were collected from mature AB wildtype females between 7–8:30 am (lights on 8:30am-10:30 pm). Results were presented as mean ± SEM (n = 5). Different letters above the error bars indicate that those groups are significantly different from each other at p < 0.05. (C) Zygotic expression of adamts9 in developing embryos determined by qPCR. Results were presented as mean ± SEM (n = 6). Different letters above the error bars indicate that those groups are significantly different from each other at p < 0.05.

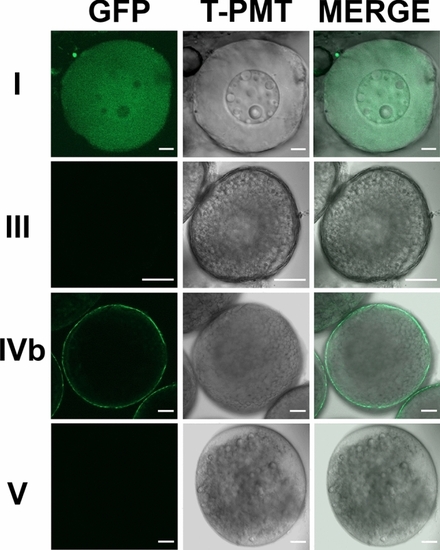
Strong expression of Adamts9 in preovulatory follicles, weak or no expression in immature ovarian follicles or ovulated oocytes in Adamts9 transgenic lines (Tg(adamts9:GFP)). The expression of Adamts9 was determined by EGFP expression driven by adamts9 promoters located in a 4.5 kb upstream sequence of adamts9 start codon. Representative confocal slice images of stage I (immature pre-vitellogenic), III (immature vitellogenic), IVb (mature & preovulatory) follicles and stage V ovulated oocytes were shown. Follicles or oocytes were confocal imaged under EGFP and transmit light (T-PMT) channels. Similar expression was confirmed in the follicles or oocytes of several F1 and F2 adult females from five independent transgenic lines. Scale bar: 10 μm (stage I); 100 μm (stages III, IVb, V).

Expression of Adamts9 in F2 transgenic (Tg(adamts9:GFP)) embryos during embryonic development. The expression of Adamts9 was determined by EGFP expression driven by adamts9 promoters located in a 4.5 kb upstream sequence of adamts9 start codon. Representative confocal z-stack images of various stages of development embryos were imaged by a confocal microscope under EGFP or transmit light (T-PMT) channels. Similar expression was confirmed in multiple F2 embryos from five independent F1 transgenic lines (Tg(adamts9:GFP)). Scale bar: 200 μm.

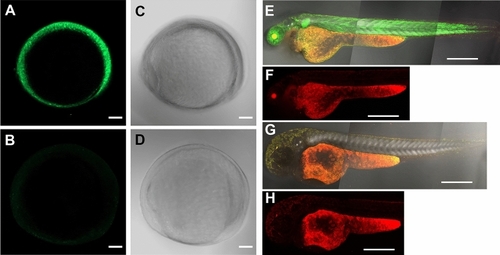
Strong Adamts9 expression in F2 transgenic (Tg(adamts9:GFP) zebrafish embryos. The expression of Adamts9 was determined by EGFP expression driven by adamts9 promoters located in a 4.5 kb upstream sequence of adamts9 start codon. Same conditions were used for imaging embryos under the EGFP, red (for monitoring autofluorescence), and transmit light (T-PMT) channels. Picture (A) is z-stack confocal images of a representative F2 transgenic embryo at 10 h post fertilization (hpf) from GFP channel; Picture B is a wildtype control embryo imaged under same condition. Pictures (C) or (D) are corresponding images of same embryo from pictures A or B using T-PMT channel. Pictures (E,F) are confocal z-stack images of a representative F2 transgenic embryo at 48 hpf, while pictures (G,H) are confocal z-stack images of a wildtype embryo at 48 hpf. Pictures (E,G) are merged confocal z-stack images from all three channels, while pictures (F,H) were confocal z-stack images from red channel to show background. Scale bar: 100 μm (AD), 400 μm (EH).

Delayed primordial germ cell (PGC) migration in Adamts9 knockout zebrafish during early development. PGC is labeled with GFP by crossing Adamts9 KO with Tg(vasa:GFP). Distance between two most distant PGCs were determined as an indicator of PGC migration (See Fig. 7 for detail). Showing distance, number of PGC, or representative images of zebrafish embryos at 15, 24 or 48 h post fertilization (hpf) in wildtype (+/+), heterozygous (+/–), and homozygous (–/–) Adamts9 KO. Embryos from at least 4 sets of parents were analyzed. The numbers on the left side of the forward slash is the number of embryos analyzed, and the numbers on the right side of the forward slash indicate sets of parents used for producing these embryos. Top panels are representative confocal images showing entire or part of embryos with GFP labeled PGC at a low magnification (scale bar: 200 μm). Bottom row are magnified confocal images of the embryos from the top (scale bar: 50 μm).

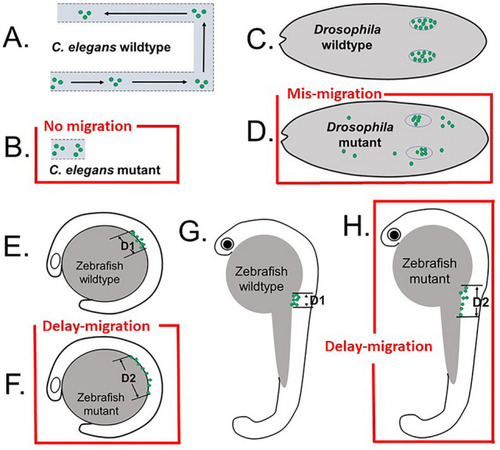
Schematic drawings show difference in the defects of germ cell migration in Adamts9 or its ortholog knockouts in C. elegans, Drosophila, and zebrafish models. Green dots denote primordial germ cells (PGC). Only the posterior gonad arm is shown for C. elegans. (A) PGCs migrate in wildtype C elegans, (B) no migration occurs in gon-1 mutant (modified from Blelloch and Kimble14,15). (C) PGCs migrate correctly in wildtype Drosophila and clustered together at gonadal ridge at stage 16 embryo. (D) PGC mis-migrate in AdamTS-A knockout embryos (modified from Ismat et al.17). E–H. All PGC migrate toward gonadal ridge in zebrafish embryos, though these PGC were distributed in wider area (D2 > D1) in the Adamts9 knockouts at 15 h post fertilization (hpf, E: wildtype; F: Adamts9 KO) and 24 hpf (G: wildtype; H: Adamts9 KO), i.e. delayed migration. The migration of PGC is completed around 24hpf in wildtype embryos, but 48hpf in Adamts9 KO zebrafish embryos (see Fig. 6 for detail).

Acknowledgments
This image is the copyrighted work of the attributed author or publisher, and ZFIN has permission only to display this image to its users. Additional permissions should be obtained from the applicable author or publisher of the image. Full text @ Sci. Rep.