
- Title
-
Embryonic exposure to low concentrations of aflatoxin B1 triggers global transcriptomic changes, defective yolk lipid mobilization, abnormal gastrointestinal tract development and inflammation in zebrafish
- Authors
- Ivanovics, B., Gazsi, G., Reining, M., Berta, I., Poliska, S., Toth, M., Domokos, A., Nagy, B., Staszny, A., Cserhati, M., Csosz, E., Bacsi, A., Csenki-Bakos, Z., Acs, A., Urbanyi, B., Czimmerer, Z.
- Source
- Full text @ J. Hazard. Mater.
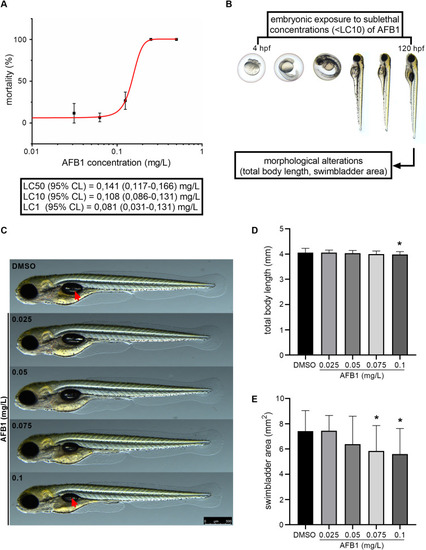
Embryonic exposure to sub-lethal concentrations of AFB1 reduces total body length and swim bladder area. (A) Concentration-response relationship and the estimated LC% values for 120 h toxicity test of zebrafish embryos exposed to AFB1 (n = 6 replicates, n = 10 embryo per replicate). (B) Schematic representation of the applied experimental system. (C) Representative images of 120 hpf zebrafish larvae after embryonic, sub-lethal exposure to AFB1. Red arrows indicate swim bladder. Scale bar = 500 µm. The graphs showing (D) total body length and (E) swim bladder area of control, and AFB1-exposed 120 hpf larvae (n = 3 replicates, n = 10 larvae per replicate). Data represent the mean and SD. “*” indicates statistical significance at p < 0.05 vs. the control (DMSO). PHENOTYPE:
|
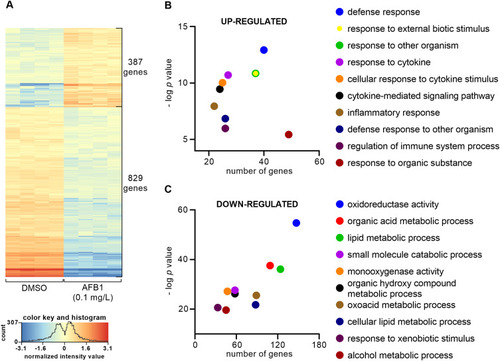
Embryonic exposure to AFB1 results in global gene expression changes in zebrafish larvae. (A) Heat map showing the differentially expressed genes between the control (DMSO) and the AFB1-exposed (0.1 mg/L) 120 hpf larvae. Data represent the normalized gene expression values of the four independent biological replicates per treatment. (B) Scatter plot showing the top 10 most significantly over-represented Gene Ontology terms among up-regulatedgenes in AFB1-exposed 120 hpf larvae. Y-axis represents the negative log (base 10) of the term significance (p-value). X-axis represents the number of genes associated with the term. (C) Scatter plot showing the top 10 most significantly over-represented Gene Ontology terms among down-regulated genes in AFB1-exposed 120 hpf larvae. Y-axis represents the negative log (base 10) of the term significance (p-value). X-axis represents the number of genes associated with the term. PHENOTYPE:
|
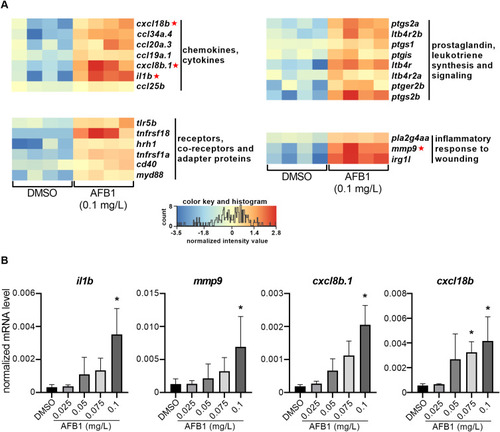
AFB1 induces the expression of immune- and inflammation-related genes in zebrafish larvae. (A) Heat maps illustrating the significantly up-regulated immune response- and inflammation-associated genes in the AFB1 (0.1 mg/L) -exposed 120 hpf zebrafish larvae compare to the control. Data represent the normalized gene expression values of the four independent biological replicates per treatment. Red asterisks indicate the selected genes for RT-qPCR. (B) RT-qPCR-based gene expression on a set of AFB1-induced inflammatory genes in the AFB1 (0.025–0.1 mg/L) -exposed 120 hpf zebrafish larvae (n = 5 replicates, n = 30 pooled larvae per replicate). Data represent the mean and SD. “*” indicates statistical significance at p < 0.05 vs. the control (DMSO). |
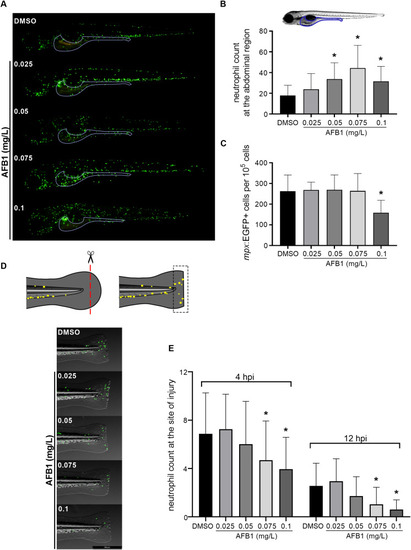
AFB1 alters the distribution of neutrophil granulocytes and modulates the inflammatory response to a local injury in zebrafish larvae. (A) Representative images of 120 hpf neutrophil-reporter Tg(mpx:EGFP) larvae after embryonic, sub-lethal exposure to AFB1. Scale bar = 500 µm. (B) The number of neutrophils counted in the abdominal region of the control and AFB1-exposed larvae (n = 3 replicates, n = 10 larvae per replicates). (C) Flow cytometric detection of mpx:EGFP+cells per 100.000 cells in control and AFB1-exposed larvae (n = 6 replicates, n = 15 pooled larvae per replicate). (D) Schematic figure of the tail fin transection model and the representative images of the transected fins of control and AFB1-exposed Tg(mpx:EGFP) larvae at 4 h post injury. After tail fin transection, neutrophils started to migrate to the site of injury. Scale bar = 500 µm (E) The graph showing the number of neutrophils at the wound site at 4 h and 12 h post injury (n = 5 replicates, n = 10 larvae per replicate). Data represent the mean and SD. “*” indicates statistical significance at p < 0.05 vs. the control (DMSO). |

AFB1 induces nitric oxide production and arginine depletion in zebrafish larvae. (A) Representative fluorescence images of DAF-FM-DA stained 120 hpf larvae after embryonic exposure to AFB1. Fluorescence signals indicate nitric-oxide generation. Scale bar = 500 µm. The graphs showing the mean fluorescence intensities of (B) the whole larvae and (C) the abdominal region (yolk and intestinal area) of the larvae after AFB1 exposure (n = 2 replicates, n = 10 larvae per replicate). (D) Schematic representation of iNOS enzyme-catalyzed NO synthesis. (E)The graph showing the normalized free L-arginine levels of 120 hpf larvae after AFB1 exposure (n = 3 replicates, n = 30 pooled larvae per replicate). Data represent the mean and SD. “*” indicates statistical significance at p < 0.05 vs. the control (DMSO). PHENOTYPE:
|
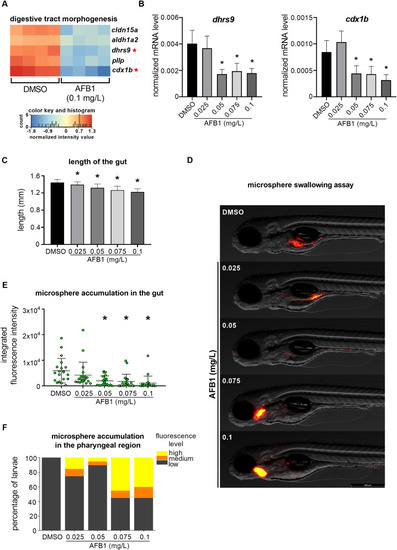
Embryonic exposure to AFB1 impairs gastrointestinal tract development in zebrafish larvae. (A) Heat map illustrating significant down-regulation of digestive tract development-associated gene set in the AFB1 (0.1 mg/L) -exposed 120 hpf zebrafish larvae compared to the control. Data represent the normalized gene expression values of the four independent biological replicates per treatment. Red asterisks indicate the selected genes for RT-qPCR. (B) RT-qPCR-based analysis of 2 selected gastrointestinal tract development-related genes after embryonic exposure to different sub-lethal concentrations of AFB1 (n = 5 replicates, n = 30 pooled larvae per replicate). (C) Length of the larval gut after AFB1 exposure (n = 3 replicates, n = 10 larvae per replicate). (D) Microsphere swallowing assay. Representative images of 120 hpf zebrafish larvae incubated in fluorescence microsphere suspension after AFB1 exposure. Scale bar = 500 µm (E) Scatter plot representing the integrated fluorescence intensities of the swallowed microspheres accumulated in the larval gut after AFB1 exposure (n = 2 replicates, n = 10 larvae per replicate). (F) Proportion of the larvae observed in different fluorescence categories indicating the microsphere accumulation level in the pharyngeal region (n = 2 replicates, n = 10 larvae per replicate). Fluorescence level was categorized as “low” < 5 × 10⁴, 5 × 10⁴ < ”medium”< 5 × 10⁵ and 5 × 10⁵ < ”high” (expressed as the sum of the pixel values). Data represent the mean and SD. “*” indicates statistical significance at p < 0.05 vs. the control (DMSO). |
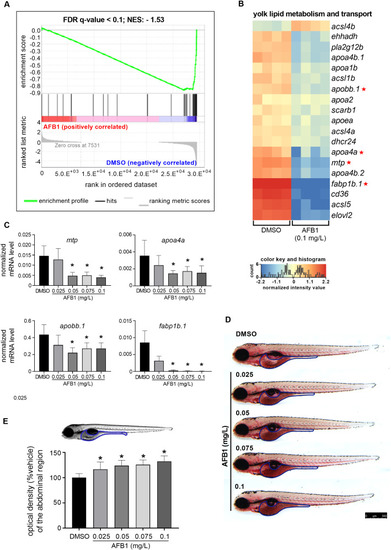
Embryonic exposure to AFB1 disrupts yolk lipid metabolism in zebrafish larvae. (A) Gene set enrichment analysis (GSEA) of lipid metabolism and transport-associated genes in 120 hpf zebrafish larvae exposed to 0.1 mg/L AFB1. The selected lipid-associated genes were identified in the zebrafish yolk by Fraher et al. (2016). FDR: false discovery rate; NES: normalized enrichment score. (B) Heat map illustrating the expression level of 19 lipid-associated genes identified by GSEA between the control and the AFB1-exposed larvae. Data represent the normalized gene expression values of the four independent biological replicates per treatment. Red asterisks indicate the selected genes for RT-qPCR. (C) RT-qPCR-based analysis of four selected yolk lipid metabolism and transport-related genes after embryonic exposure to different sub-lethal concentrations of AFB1 (n = 5 replicates, n = 30 pooled larvae per replicate) (D) Representative images of Oil Red O (ORO) stained 120 hpf larvae after AFB1 exposure. ORO staining indicates the lipid content and distribution in the larvae. Scale bar = 500 µm. (E) Lipid content was evaluated by optical density (OD) measurement. The graph showing OD values of the abdominal region relative to the control (100%) after AFB1 exposure (n = 2 replicates, n = 10 larvae per replicate). Data represent the mean and SD. “*” indicates statistical significance at p < 0.05 vs. the control (DMSO). |
Reprinted from Journal of hazardous materials, 416, Ivanovics, B., Gazsi, G., Reining, M., Berta, I., Poliska, S., Toth, M., Domokos, A., Nagy, B., Staszny, A., Cserhati, M., Csosz, E., Bacsi, A., Csenki-Bakos, Z., Acs, A., Urbanyi, B., Czimmerer, Z., Embryonic exposure to low concentrations of aflatoxin B1 triggers global transcriptomic changes, defective yolk lipid mobilization, abnormal gastrointestinal tract development and inflammation in zebrafish, 125788, Copyright (2021) with permission from Elsevier. Full text @ J. Hazard. Mater.