
- Title
-
Deficiency in Neuroserpin Exacerbates CoCl2 Induced Hypoxic Injury in the Zebrafish Model by Increased Oxidative Stress
- Authors
- Han, S., Zhang, D., Dong, Q., Wang, X., Wang, L.
- Source
- Full text @ Front Pharmacol
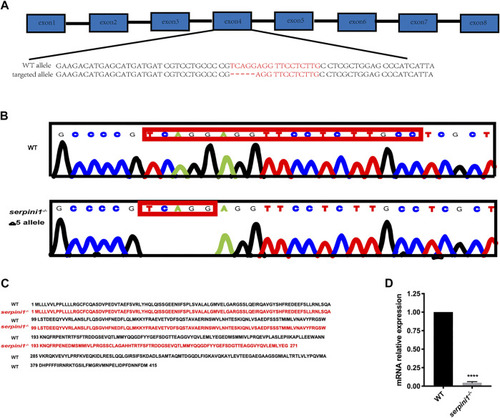
Generation of |
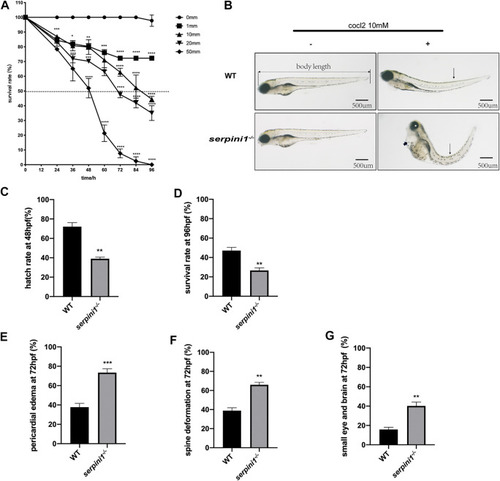
The developmental morphology defects of WT and PHENOTYPE:
|
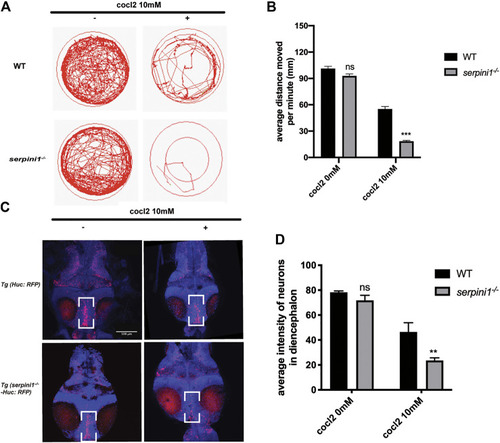
Neuroserpin deficient zebrafish showed reduced locomotor activities and more neurons loss in diencephalon area under CoCl2 induced hypoxic injury. |
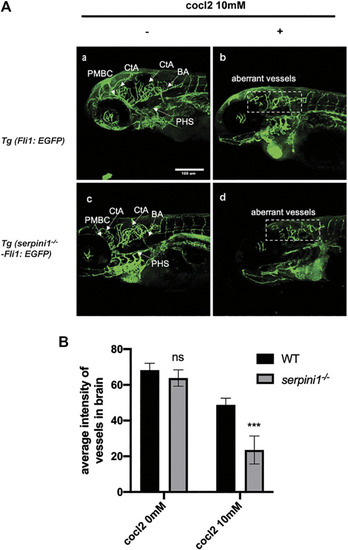
More severe vascular malformation in neuroserpin deficient zebrafish under CoCl2 induced hypoxic injury. PHENOTYPE:
|
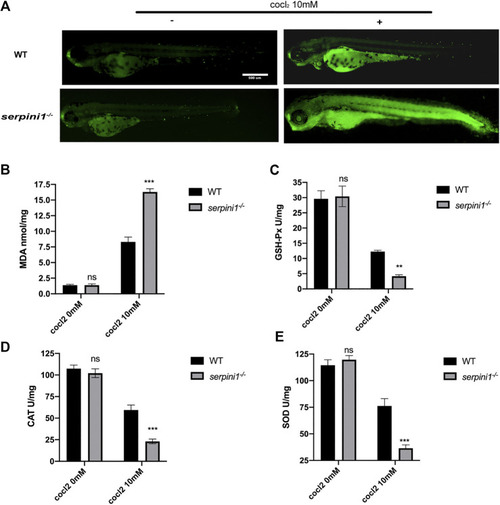
Apoptosis and oxidative stress were more severely enhanced in PHENOTYPE:
|