
- Title
-
MicroRNA-1 affects the development of the neural crest and craniofacial skeleton via the mitochondrial apoptosis pathway
- Authors
- Zhao, N., Qin, W., Wang, D., Raquel, A.G., Yuan, L., Mao, Y., Ma, C., Xiao, Z., Ma, J.
- Source
- Full text @ Exp. Ther. Med.
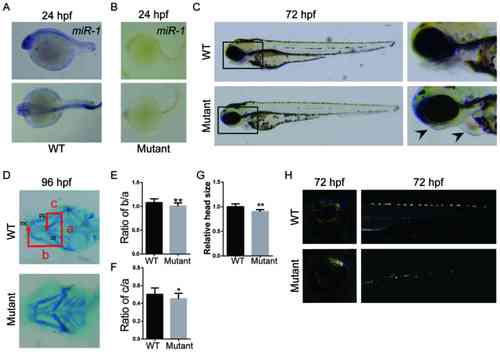
Loss of miR-1 in zebrafish results in craniofacial, pigment cell and cardiac defects. In situ hybridization of miR-1 in (A) wild-type and (B) mutant zebrafish at 24 hpf. (C) Zebrafish larvae at 72 hpf with mutants exhibiting mandibular retrognathia (left arrow) and edema around the heart (right arrow). (D) Alcian blue staining at 96 hpf. (E) Quantitative analysis of b/a. (F) Quantitative analysis of c/a. a, width between ch; b, distance between mc and ch; and c, the distance between pq and ch. (G) Quantitative analysis of head size. (H) Distribution and number of iridophores at 72 hpf. Data are presented as the mean ± standard deviation (n=5). *P<0.05 and **P<0.01 vs. WT. WT, wild-type; hpf, hours post-fertilization; miR-1, microRNA-1; mc, Meckel's cartilage; pq, palatoquadrate; ch, ceratohyal cartilage. |
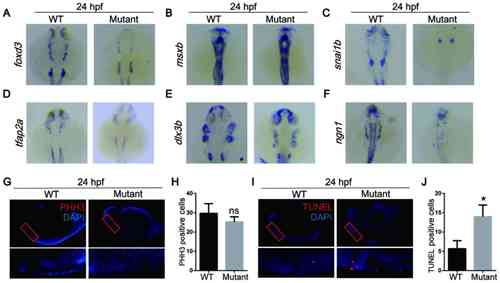
MicroRNA-1 knockout affects neural crest cell apoptosis during the migration and differentiation periods of embryonic development. In situ hybridization of zebrafish at 24 hpf with (A) foxd3, (B) msxb, (C) snai1b, (D) tfap2a, (E) dlx3b and (F) ngn1 probes. (G) Whole mount immunostaining of zebrafish at 24 hpf with PHH3 (red) and DAPI (blue). (H) Quantitative analysis of immunostaining. (I) TUNEL staining at 24 hpf with TUNEL (red) and DAPI (blue). (J) Quantitative analysis of TUNEL staining. Data are presented as the mean ± standard deviation (n=5). *P<0.05 vs. WT. WT, wild-type; foxd3, forkhead box D3; msxb, muscle segment homeobox-B; snai1b, snail homolog 1b; tfap2a, transcription factor AP2A; dlx3b, distal-less 3; ngn1, neurog1; PHH3, phospho-histone H3; hpf, hours post fertilization; ns, not significant. |
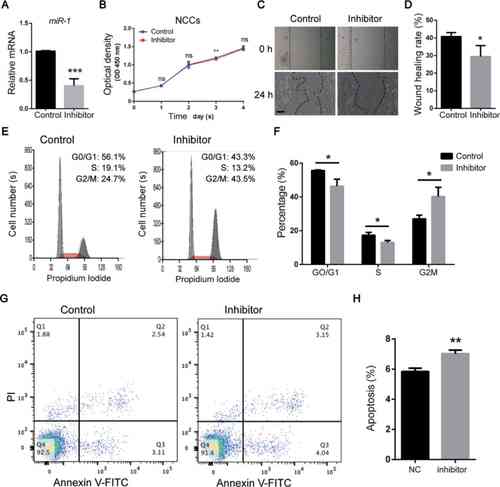
miR-1 regulates the function of NCCs in vitro. (A) miR-1 expression assessed via reverse transcription-quantitative PCR following transfection with the miR-1 inhibitor. (B) Cell proliferation of NCCs analyzed by Cell Counting Kit-8 assay. (C) Wound healing assay of NCCs. Scale bar, 100 µm. (D) Quantitative analysis of wound healing assay. (E) Cell cycle analysis of NCCs performed using flow cytometry. (F) Quantitative analysis of cell cycle analysis. (G) Apoptosis analysis of NCCs evaluated via flow cytometry. (H) Quantitative analysis of apoptosis analysis. Data are presented as the mean ± standard deviation (n=3). *P<0.05, **P<0.01 and ***P<0.001 vs. Control. NCCs, neural crest cells; miR-1, microRNA-1; PI, propidium iodide. |
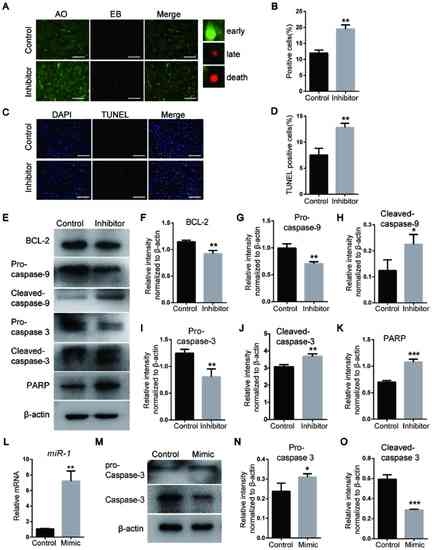
miR-1 affects the apoptosis of neural crest cells via the mitochondrial apoptosis pathway and caspase-3. (A) Detection of apoptosis on day 3 following miR-1 inhibitor transfection using AO/EB staining. Scale bar, 100 µm. (B) Quantitative analysis of AO/EB staining. (C) TUNEL staining of NCCs. Scale bar, 100 µm. (D) Quantitative analysis of TUNEL staining. (E) Protein levels of the mitochondrial apoptosis pathway markers BCL-2, pro- and cleaved-caspase-3, pro- and cleaved-caspase-9 and PARP detected via western blotting. (F-K) Quantification of the protein levels of (F) BCL-2, (G) pro-caspase-9, (H) cleaved-caspase-9, (I) pro-caspase-3, (J) cleaved-caspase-3 and (K) PARP, which are presented in (E). (L) miR-1 expression assessed by reverse transcription-quantitative PCR. (M) Expression levels of pro- and cleaved-caspase-3 after transfection with the miR-1 mimic. (N and O) Quantification of the protein levels. Data are presented as the mean ± standard deviation (n=3). *P<0.05, **P<0.01 and ***P<0.001 vs. Control. miR-1, microRNA-1; PARP, poly ADP-ribose polymerase, AO, acridine orange; EB, ethidium bromide. |