
|
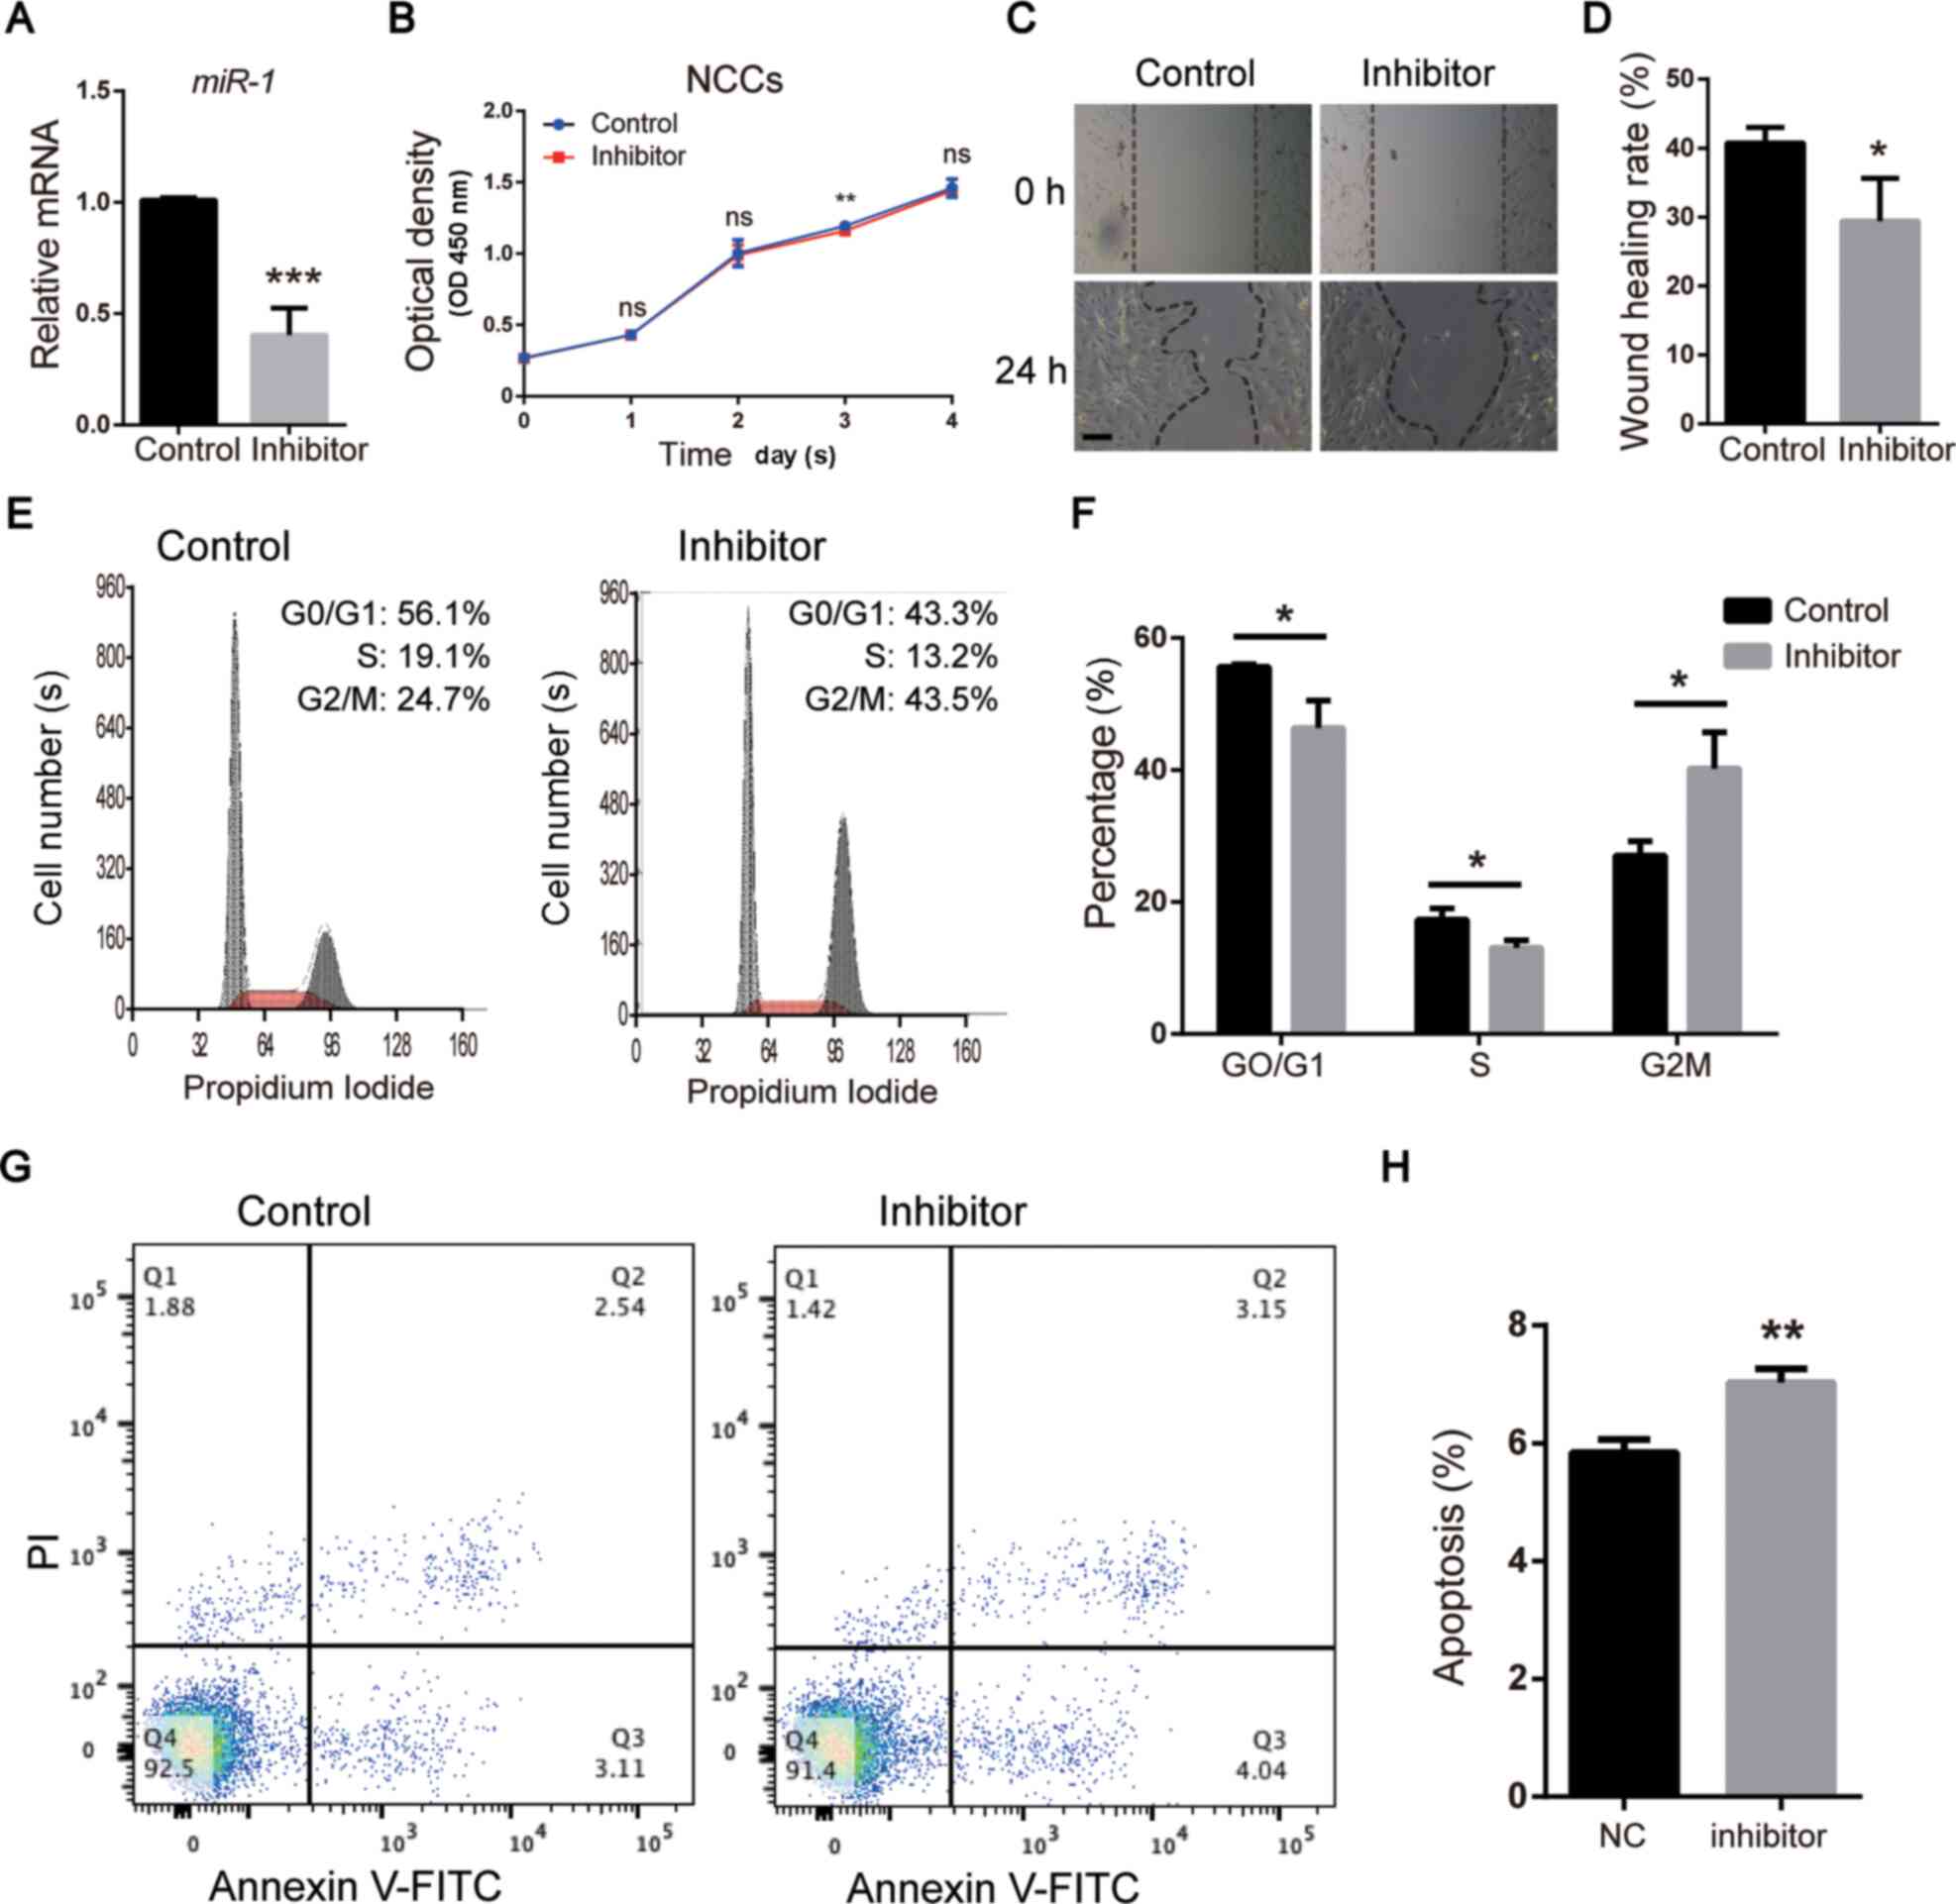
Fig. 3 miR-1 regulates the function of NCCs in vitro. (A) miR-1 expression assessed via reverse transcription-quantitative PCR following transfection with the miR-1 inhibitor. (B) Cell proliferation of NCCs analyzed by Cell Counting Kit-8 assay. (C) Wound healing assay of NCCs. Scale bar, 100 µm. (D) Quantitative analysis of wound healing assay. (E) Cell cycle analysis of NCCs performed using flow cytometry. (F) Quantitative analysis of cell cycle analysis. (G) Apoptosis analysis of NCCs evaluated via flow cytometry. (H) Quantitative analysis of apoptosis analysis. Data are presented as the mean ± standard deviation (n=3). *P<0.05, **P<0.01 and ***P<0.001 vs. Control. NCCs, neural crest cells; miR-1, microRNA-1; PI, propidium iodide.