FIGURE SUMMARY
Title

Efficient CRISPR-Cas9-Mediated Knock-In of Composite Tags in Zebrafish Using Long ssDNA as a Donor

Authors
Ranawakage, D.C., Okada, K., Sugio, K., Kawaguchi, Y., Kuninobu-Bonkohara, Y., Takada, T., Kamachi, Y.
Source
Full text @ Front Cell Dev Biol

Design of composite tag knock-in through the CRISPR-Cas9 system. In this design, an ∼200-nt length composite that contains either a FLAG or PA epitope tag in its trimeric form followed by a tobacco etch virus (TEV) protease cleavage site, a biotin acceptor domain (Bio tag), and a C-terminus HiBiT peptide tag was knocked into the 3′ end of the coding sequence of the sox3 gene. A long ssDNA donor fragment that contains the composite tag flanked at both ends by the homology arms that corresponds to the CDS upstream from the stop codon (5′ homology arm) and the 3′ UTR downstream from the stop codon (3′ homology arm) of the sox3 gene was used as a template to induce the homology-directed repair (HDR) mechanism after the CRISPR-Cas9-mediated double-strand break (DSB).

Cleavage efficiency of the selected crRNA. (A) Schematic illustration of the CRISPR-Cas9 ribonucleoprotein (RNP) complex and injection into a one-cell stage zebrafish embryo. (B) Candidate crRNA location and sequence. Double-strand break occurs 2 bases upstream from the stop codon for the selected crRNA. (C) Heteroduplex mobility assay (HMA) to evaluate the cleavage efficiency of crRNA. A 1.5 or 3 fmol RNP complex was microinjected, and genomic DNA was extracted from three pools of five embryos each at 1 dpf. Primers used for HMA are listed in Supplementary Table 1. (D) Percentage of indel mutations by Inference of CRISPR Edits (ICE) analysis.

Effect of the lssDNA strand choice on knock-in efficiency. (A) Definition of the target and non-target strands in relation to the CRISPR-Cas9 complex. The strand that is complementary to the crRNA sequence is referred to as the target strand. (B) The target and non-target strands of lssDNA used as a donor template. Each lssDNA was microinjected with 1.5 fmol of the RNP complex into the cytoplasm of one-cell stage zebrafish embryos, and genomic DNA was extracted from 20-embryo pools. (C) Schematic illustration of the sox3 knock-in allele and knock-in allele-specific PCR. (D) Agarose gel image showing the PCR amplicons of knock-in allele-specific PCR at the 3′ junction of the integration and the β-actin2 gene-specific PCR (control) to confirm DNA integrity.

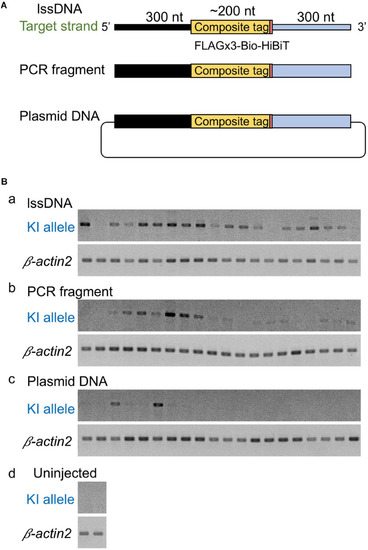
Comparison of donor DNA template types. (A) Donor DNA templates used in this comparison. (B) Knock-in (KI) allele-specific PCR amplification for the 5′ junction. lssDNA (a), PCR fragments (b), or plasmid DNA (c) was microinjected with 1.5 fmol of the RNP complex into the cytoplasm of one-cell stage zebrafish embryos, and genomic DNA was extracted from 20 individual zebrafish embryos. As a negative control, knock-in allele-specific PCR amplification was performed using uninjected zebrafish embryos (d). β-actin2 gene-specific PCR was performed to confirm DNA integrity.

Effect of lssDNA 3′ homology arm length on knock-in efficiency. (A) Donor lssDNA templates with different 3′ homology arm lengths used for comparison. (B) Schematic illustration of the sox3 knock-in allele and knock-in allele-specific PCRs for 5′ and 3′ junctions. Each lssDNA was microinjected with 1.5 fmol of the RNP complex into the cytoplasm of one-cell stage zebrafish embryos, and genomic DNA was extracted from 20-embryo pools. (C) Agarose gel image showing the PCR amplicons of knock-in allele-specific PCRs and the β-actin2 gene-specific PCR (control) to confirm DNA integrity. (D) Knock-in allele-specific qPCRs for 5′ and 3′ junctions using the hydrolysis probes shown in (B). The vertical bars represent the means of 8–10 replicates, each of which consists of a pooled sample of 10 injected embryos and is shown as a colored circle.

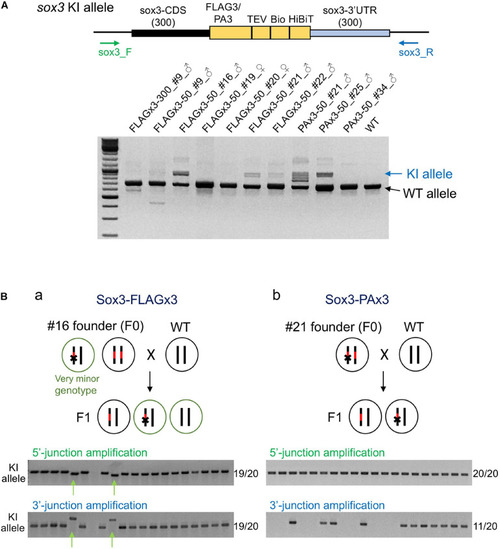
Founder germ cell mosaicism. (A) Mosaicism analysis by PCR using genomic DNA from F1 embryo pools. F1 embryos from out-crosses of the founders with wild-type fish were pooled (50–100 embryos per pool) and used for genomic DNA preparation. The PCR primers bind outside of the homology arms to amplify both wild-type (WT) and knock-in (KI) alleles as indicated by the arrows. The agarose gel electrophoresis image represents the PCR amplicons of each founder along with the wild-type fish. (B) Mosaicism analysis by PCR using genomic DNA from individual F1 embryos. Possible genotypes of germ cells of biallelic knock-in founders and F1 embryos are illustrated. Individual F1 progeny embryos from out-crosses of FLAGx3-50_#16 (a) and PAx3-50_#21 (b) founders were subjected to genomic DNA preparation and PCR amplification of 5′ and 3′ junctions of the composite tag-modified sox3 gene. A total of 20 embryos were analyzed per founder. The number of PCR positive embryos per total embryos for each PCR amplification is shown on the right side of each agarose gel image. The minor knock-in allele with imprecisions is indicated with green arrows (Ba).

Expression of the tagged Sox3 protein. (A) Western blot and HiBiT blot analyses of the tagged Sox3 protein. Two-color Western blot analysis of sox3 knock-in embryos derived from the FLAGx3-50_#16 (a) and PAx3-50_#21 founders (b) with antibodies against Sox3, FLAG tag or PA tag, and α-tubulin. HiBiT blotting using an excessive amount of LgBiT protein and substrate to detect the C-terminal HiBiT peptide of the tagged Sox3 proteins (c). (B) Whole-mount immunohistochemical staining for the tagged Sox3 protein. Each primary antibody used to stain zebrafish is indicated below each image. Genotyping was conducted using PCR with genomic DNA prepared from the immunostained embryos after image acquisition.

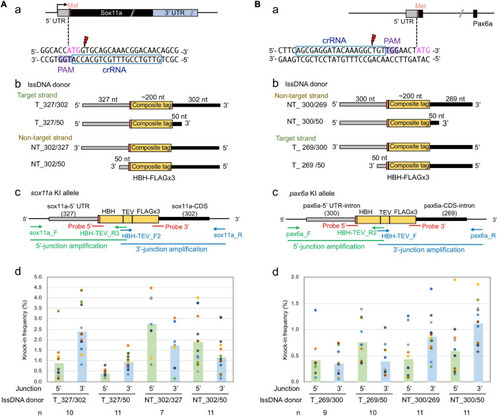
Effect of lssDNA strand choice and 3′ homology arm length on composite tag knock-in into the sox11a and pax6a genes. In these knock-in designs, ∼200-nt-long composites that contain the HBH (His6-Bio-His6) tag followed by a TEV protease cleavage site and FLAG epitope tag in its trimeric form were knocked into the 5′ end of the coding sequence of the sox11a(A) and pax6a(B) genes. (a) Sequences and locations of crRNAs for DSB induction of sox11a and pax6a. (b) Target and non-target strands of lssDNA with different 3′ homology arm lengths were used as donor templates. Each lssDNA was microinjected with 1.5 fmol of the RNP complex into one-cell stage zebrafish embryos, and genomic DNA was extracted from 10-embryo pools. (c) Schematic illustration of the sox11a and pax6a knock-in alleles and knock-in allele-specific PCRs. (d) Knock-in allele-specific qPCRs for 5′ and 3′ junctions using the hydrolysis probes shown in panel (c). The vertical bars represent the means of 7–11 replicates, each of which consists of a pooled sample of 10 injected embryos and is shown as a colored circle.

Acknowledgments
This image is the copyrighted work of the attributed author or publisher, and ZFIN has permission only to display this image to its users. Additional permissions should be obtained from the applicable author or publisher of the image. Full text @ Front Cell Dev Biol