
- Title
-
Precise base editing for the in vivo study of developmental signaling and human pathologies in zebrafish
- Authors
- Rosello, M., Vougny, J., Czarny, F., Mione, M.C., Concordet, J.P., Albadri, S., Del Bene, F.
- Source
- Full text @ Elife
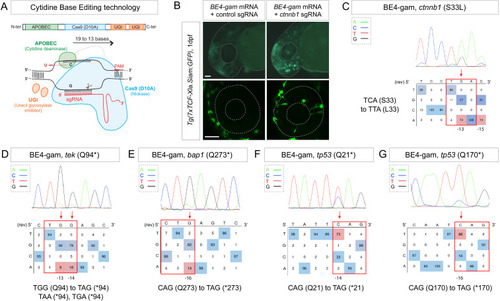
(A) Schematic representation of the cytidine base editor technology. (B) Activation of Wnt signaling via S33L mutation in β-catenin. 1 dpf Tg(7xTCF-Xla.Siam:GFP) representative embryos injected with BE4-gam mRNA and ctnnb1 (S33L) sgRNA or control scrambled sequence. The upper panel shows an overall increase of GFP-positive cells in the head/anterior region upon the injection of the BE4-gam mRNA and ctnnb1 (S33L) sgRNA compared to the control situation. The lower panel shows maximal z-projection of lateral view of the injected embryos where ectopic GFP signal in retinal progenitor cells (white stars) can be detected, whereas control embryos do not show any fluorescence in the retina at this stage. (C–G) DNA sequencing chromatogram of targeted loci with the BE4-gam and obtained C-to-T conversion efficiencies. The chromatograms correspond to the highest efficiency reported for the single embryos analyzed as detailed in Table 2. (C) S33L mutation in β-catenin upon C-to-T conversion in ctnnb1 reached 73% of gene-editing efficiency. The other edited C led to a silent mutation GAC (D) to GAT (D). (D) Q94* mutation in Tek upon C-to-T conversion in tek reached 18% of gene-editing efficiency. (E) Q273* mutation in Bap1 upon C-to-T conversion in bap1 reached 14% of gene-editing efficiency. (F) Q21* mutation in p53 upon C-to-T conversion in tp53 reached 73% of gene-editing efficiency. (G) Q170* mutation in p53 upon C-to-T conversion in tp53 reached 86% of gene-editing efficiency. For (C) and (E), the reverse complement of the sgRNA sequence is shown. Scale bars: (B) 50 µm. (D–G) Numbers in the boxes represent the percentage of each base at that sequence position. In red are highlighted the base substitutions introduced by base editing, while the original bases are in blue. The color code of the chromatogram is indicated in the upper left corner (Adenine green, Cytosine blue, Thymine red, Guanine black). The distance from the PAM sequence of the targeted C base is indicated below each chromatogram. It is considered that the quantifications under 5% are due to the background signal from Sanger sequencing and are thus non-significant (Kluesner et al., 2018). |
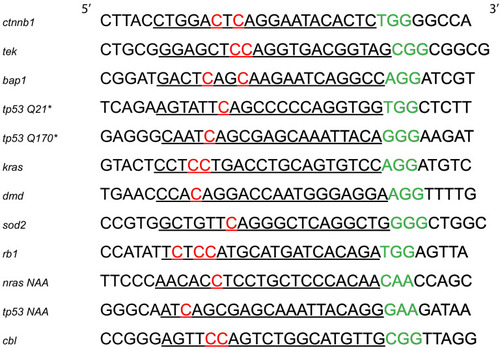
List of all the targeted loci in this study. In red are highlighted the targeted C bases, underlined are the sgRNAs and in green the associated PAM sequences. Sequences are oriented from 5’ to 3’. |
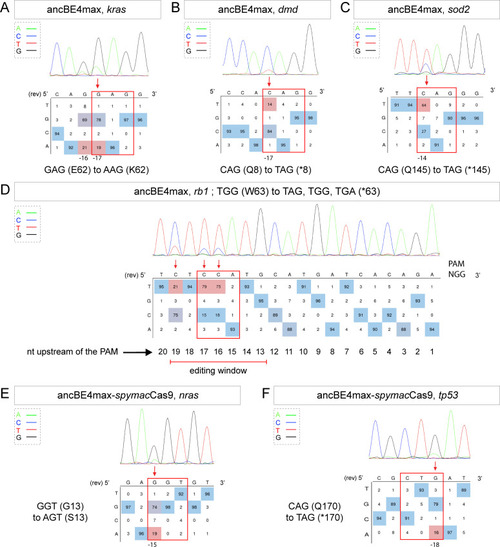
(A–F) DNA sequencing chromatogram of targeted loci with the ancBE4max (in A–D) or ancBE4max-SpymacCas9 (in E,F) and obtained C-to-T conversion efficiencies. (A) E62K mutation in Kras upon C-to-T conversion in kras reached 19% gene-editing efficiency. The other edited C led to a silent mutation CAG (Q) to CAA (Q). (B) Q8* mutation in Dmd upon C-to-T conversion in dmd reached 14% of gene-editing efficiency. (C) Q145* mutation in Sod2 upon C-to-T conversion in sod2 reached 64% of gene-editing efficiency. (D) W63* mutation in Rb1 upon C-to-T conversion in rb1 reached 21% for the C19 base, 79% for C17, and 75% for the C16 of gene-editing efficiency. (E) G13S mutation in Nras upon C-to-T conversion in nras reached 19% of gene-editing efficiency. (F) Q170* mutation in p53 upon C-to-T conversion in tp53 reached 16% of gene-editing efficiency. For (A, D–F), the reverse complement of the sgRNA sequence is shown. (A–F) The chromatograms correspond to the efficiency reported for the single embryos provided in the first column of Table 2. The numbers in the boxes represent the percentage of each base at that sequence position. In red are highlighted the base substitutions introduced by base editing, while the original sequence is in blue. The color code of the chromatogram is indicated in the upper left corner (Adenine green, Cytosine blue, Thymine red, and Guanine black). The distance from the PAM sequence of the targeted C base is indicated below each chromatogram. It is considered that the quantifications under 5% are due to the background signal from Sanger sequencing and are thus non-significant (Kluesner et al., 2018). |
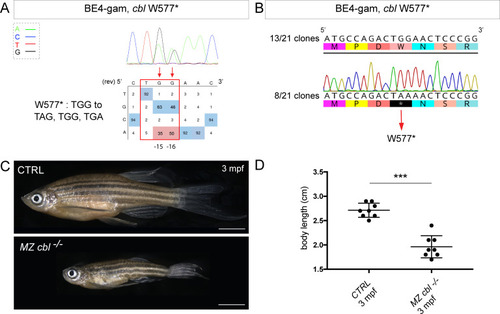
(A) DNA sequencing chromatogram of targeted cbl gene with the BE4-gam. W577* mutation in Cbl upon C-to-T conversion in cbl reached 50% for the C16 base and 35% for the C15 base of gene-editing efficiency. The chromatogram refers to the efficiency reported for the embryo provided in the first column of Table 2. The numbers in the boxes represent the percentage of each base at that sequence position. In red are highlighted the base substitutions introduced by base editing, while the original sequence is in blue. The color code of the chromatogram is indicated in the upper left corner (Adenine green, Cytosine blue, Thymine red, and Guanine black). The distance from the PAM sequence of the targeted C base is indicated below the chromatogram. It is considered that the quantifications under 5% are due to the background signal from Sanger sequencing and are thus non-significant (Kluesner et al., 2018). (B) Sequencing of individual clones of a pool of F1 embryos from a founder carrying the W577* mutation in Cbl. TGG-to-TAA precise mutation was found in 8 of 21 clones. No editing or INDELs were detected in all other clones. (C) Three months post-fertilization (mpf) cbl wild type derived from the incross of wild-type siblings (upper panel) and dwarf maternal zygotic (MZ) mutant fish found in 24% of the progeny (lower panel). (D) Quantification of the body length of the cbl+/+ controls and of the dwarf MZ cbl−/−. The dwarf fish show a significant reduced size at three mpf compared to the wild-type controls. n = 8 for each group. Mann–Whitney test, p=0,0002. Scale bars: (C) 5 mm. PHENOTYPE:
|