
Image
|
Figure Caption
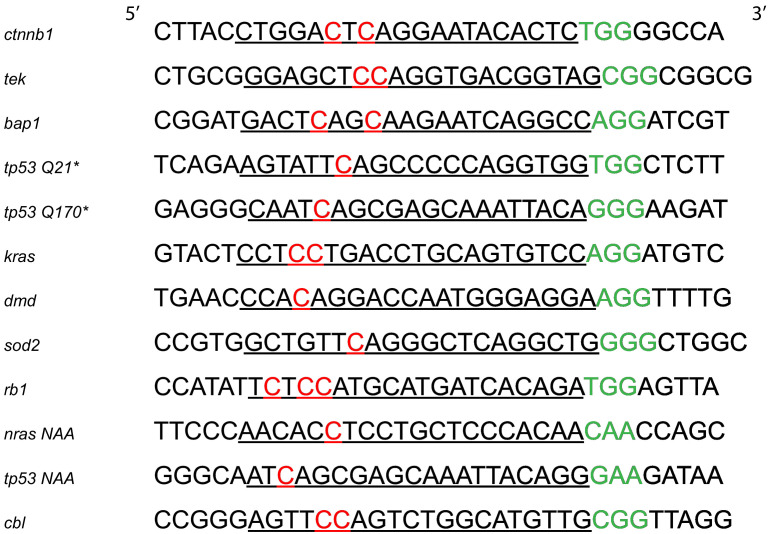
Figure 1—figure supplement 1.
List of all the targeted loci in this study. In red are highlighted the targeted C bases, underlined are the sgRNAs and in green the associated PAM sequences. Sequences are oriented from 5’ to 3’.
Acknowledgments
This image is the copyrighted work of the attributed author or publisher, and
ZFIN has permission only to display this image to its users.
Additional permissions should be obtained from the applicable author or publisher of the image.
Full text @ Elife