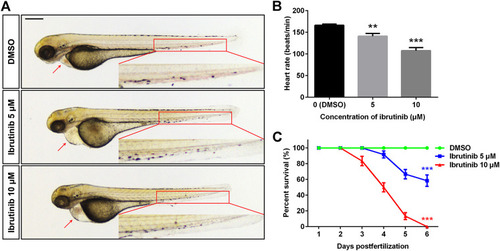
Ibrutinib had potent toxicity in zebrafish embryos. (A) Ibrutinib induced a developmental deficiency in treated embryos at 72 h post-fertilization (hpf); a shorter body length, pericardial edema, and arrested blood flow were observed. Scale bar: 300 μm. (B) Heart rate of ibrutinib-treated embryos at 72 hpf; n = 10 for each group. (C) Survival curves of embryos treated with DMSO or ibrutinib at 12 hpf, survival rate was calculated from three independent experiments; n = 60 for each group in total. Asterisks indicate significant differences (DMSO vs. ibrutinib), **p < 0.01, ***p < 0.001.

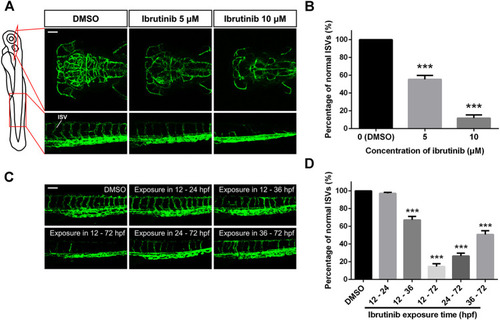
Vascular formation was perturbed in ibrutinib-treated embryos. (A) Confocal images of blood vessels in the brain and trunk of ibrutinib-treated Tg (kdrl:EGFP) embryos at 72 h post-fertilization (hpf). Scale bar: 100 μm. (B) The percentage of normal intersegmental vessels (ISVs) in embryos presented at (A); n = 10 for each group. (C) Confocal images of blood vessels in the trunk of embryos treated and washed at different stages. Scale bar: 100 μm. (D) The percentage of normal ISVs in embryos presented at (C); n = 10 for each group. Asterisks indicate significant differences (DMSO vs. ibrutinib), ***p < 0.001.

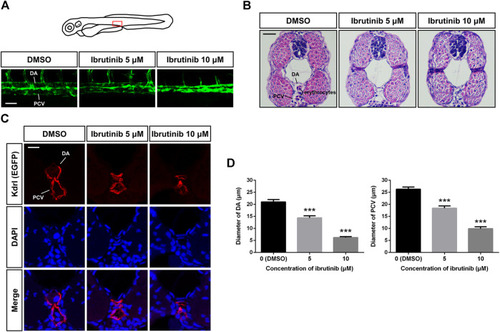
Vascular lumens were collapsed after ibrutinib treatment. (A) Confocal images of the dorsal aorta (DA) and posterior cardinal vein (PCV) in the trunk of ibrutinib-treated Tg (kdrl:EGFP) embryos at 72 h post-fertilization (hpf). Scale bar: 50 μm. (B) H&E staining of cross-sections containing the DA and PCV of treated embryos at 72 hpf. Scale bar: 20 μm. (C) Immunofluorescence staining of cross-sections containing the DA and PCV of treated embryos at 72 hpf. Scale bar: 10 μm. (D) Diameters of the DA and PCV in treated embryos at 72 hpf; n = 10 for each group. Asterisks indicate significant differences (DMSO vs. ibrutinib), ***p < 0.001.

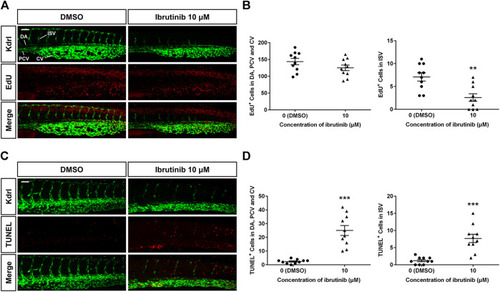
Reduced proliferation and enhanced apoptosis of vascular endothelial cells (VECs) in ibrutinib-treated embryos. (A) An EdU assay showed proliferation signals in the VECs of ibrutinib-treated embryos at 36 h post-fertilization (hpf). (B) The number of proliferated VECs was counted in the dorsal aorta (DA), posterior cardinal vein (PCV), and caudal vein (CV), as well as ISVs; n = 10 for each group. (C) A TUNEL assay showed apoptosis signals in the VECs of ibrutinib-treated embryos at 60 hpf. (D) The number of apoptotic VECs was counted in the DA, PCV, and CV, as well as intersegmental vessels (ISVs); n = 10 for each group. Asterisks indicate significant differences (DMSO vs. ibrutinib), **p < 0.01, ***p < 0.001.

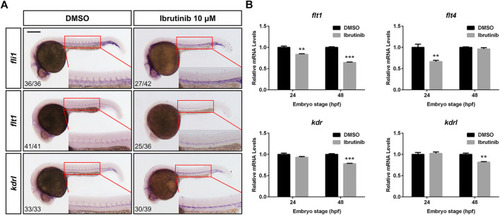
Ibrutinib exposure altered the expression of vascular development-related genes. (A) The expression pattern of vascular marker genes, fli1, flt1, and kdrl, was examined in ibrutinib-treated embryos by whole-mount in situ hybridization (WISH) at 24 h post-fertilization (hpf). Numbers at bottom left indicate the number of embryos with similar staining pattern among all embryos examined (Fisher’s exact tests, p < 0.001). (B) The qRT-PCR results showed the expression of VEGFR genes, flt1, flt4, kdr, and kdrl, in ibrutinib-treated embryos at 24 and 48 hpf. Asterisks indicate significant differences (DMSO vs. ibrutinib), **p < 0.01, ***p < 0.001.

Acknowledgments
This image is the copyrighted work of the attributed author or publisher, and ZFIN has permission only to display this image to its users. Additional permissions should be obtained from the applicable author or publisher of the image. Full text @ Front Pharmacol