IMAGE

FIGURE 3

ID
ZDB-IMAGE-210204-80
Source
Figures for Wang et al., 2021
Image
Figure Caption

FIGURE 3

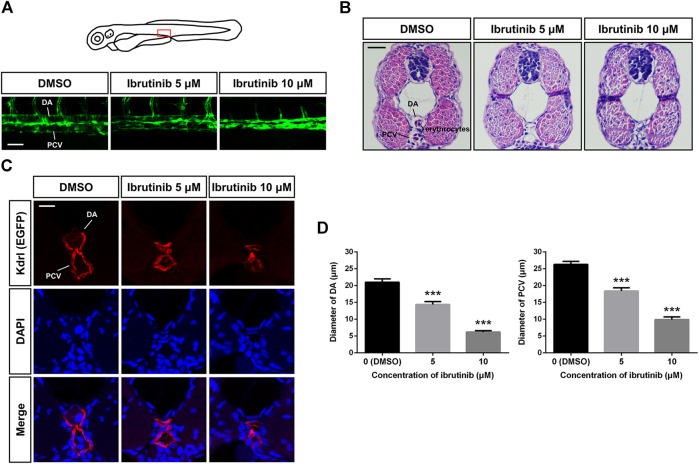
Vascular lumens were collapsed after ibrutinib treatment. (A) Confocal images of the dorsal aorta (DA) and posterior cardinal vein (PCV) in the trunk of ibrutinib-treated Tg (kdrl:EGFP) embryos at 72 h post-fertilization (hpf). Scale bar: 50 μm. (B) H&E staining of cross-sections containing the DA and PCV of treated embryos at 72 hpf. Scale bar: 20 μm. (C) Immunofluorescence staining of cross-sections containing the DA and PCV of treated embryos at 72 hpf. Scale bar: 10 μm. (D) Diameters of the DA and PCV in treated embryos at 72 hpf; n = 10 for each group. Asterisks indicate significant differences (DMSO vs. ibrutinib), ***p < 0.001.

Acknowledgments
This image is the copyrighted work of the attributed author or publisher, and ZFIN has permission only to display this image to its users. Additional permissions should be obtained from the applicable author or publisher of the image. Full text @ Front Pharmacol