
- Title
-
Protocol for Disome Profiling to Survey Ribosome Collision in Humans and Zebrafish
- Authors
- Mito, M., Mishima, Y., Iwasaki, S.
- Source
- Full text @ STAR Protoc
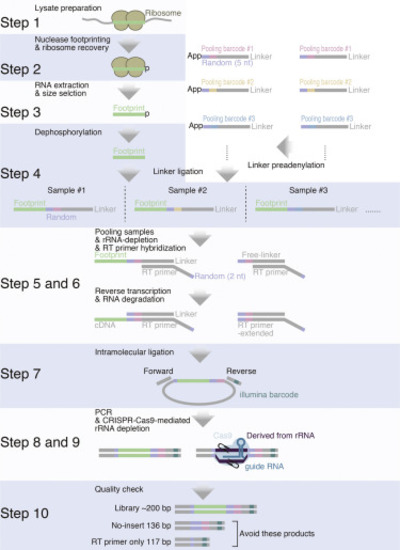
Figure 1. Overview of Disome Profiling Library Preparation |

Figure 2. Dechorionation of Zebrafish Embryos (A) Handling of embryos during dechorination. (B) Representative images of zebrafish embryos before (left) and after (middle) pronase treatment and those that were dechorinated (right). |
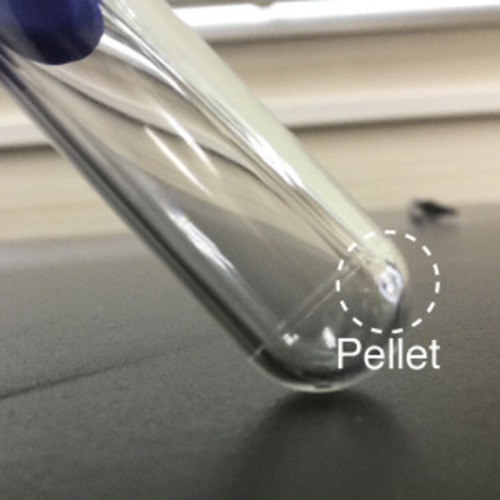
Figure 3. A Representative Image of the Ribosome Pellet Generated by Sucrose Cushion The circle indicated by a dashed white line is the ribosome pellet at the bottom of an ultracentrifuge tube that was used for downstream processes. |

Figure 4. A Representative Gel Image for Footprinting Fragment Purification The areas indicated by dashed white lines are gel-excised and used for downstream processes. |

Figure 5. A Representative Gel Image for Linker-Ligated Footprints The areas indicated by dashed white lines are gel-excised and used for downstream processes. |
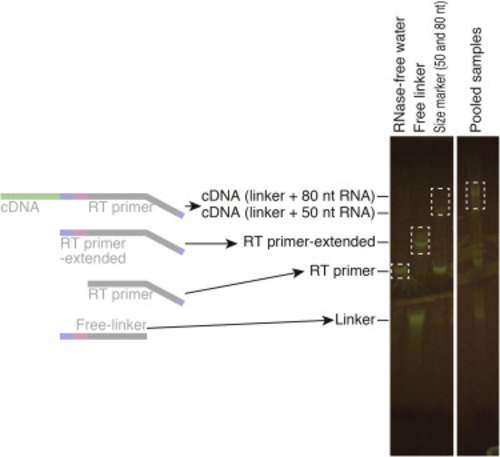
Figure 6. A Representative Gel Image for Reverse Transcribed Products The areas indicated by dashed white lines are gel-excised and used for downstream processes. |

Figure 7. A Representative Gel Image for the PCR Product to Optimize the PCR Cycles Optimal PCR conditions (eight cycles in this analysis) were used for downstream processes. |

Figure 8. A representative Gel Image for CRISPR-Cas9-Mediated rRNA Depletion The areas indicated by dashed white lines are gel-excised and used for downstream processes. |

Figure 9. A Representative Result of the Fragment Analyzer for Sequencing the DNA Library LM, lower marker; UM, upper marker. |