FIGURE SUMMARY
Title

Improving CRISPR/Cas9 mutagenesis efficiency by delaying the early development of zebrafish embryos

Authors
Terzioglu, M., Saralahti, A., Piippo, H., Rämet, M., Andressoo, J.O.
Source
Full text @ Sci. Rep.

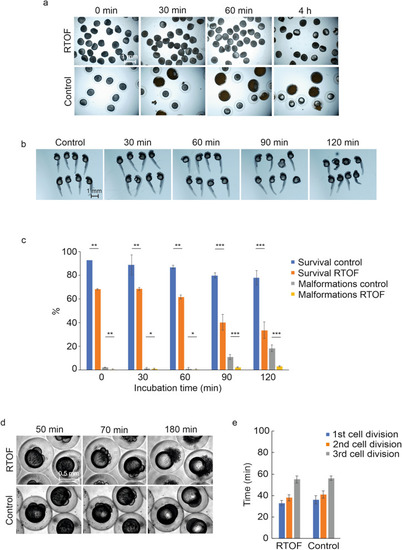
The effect of RTOF treatment on the oocyte viability and the early development of zebrafish embryos. (a) RTOF preserves zebrafish oocyte viability for at least 4 h. Oocytes were harvested by squeezing the abdomen of a competent female and incubated in RTOF or control solution (E3 water) for 4 h. Oocytes were imaged at 0, 30 and 60 min, and at 4 h. Oocytes kept in RTOF were alive and had attached chorions as a sign of preserved competence for fertilization, throughout the experiment. In contrast, control oocytes exhibited expanded chorions immediately after collection and started dying at 30 min post collection. (b,c) 30–60 min treatment with RTOF causes minor defects in the morphology and the survival of zebrafish embryos, while 90–120 min treatment causes substantially increased malformation and mortality. Fertilized zebrafish eggs were incubated in RTOF for 30, 60, 90 and 120 min after which they were moved to E3 water. The survival and well-being of the embryos was followed for 48 h and compared to E3 treated group. n(Control) = 348, n(RTOF 30 min) = 296, n(RTOF 60 min) = 202, n(RTOF 90 min) = 196, n(RTOF 120 min) = 240. (d) The comparative developmental stages of the control (E3 treated) and the RTOF treated embryos at indicated time points post fertilization. Newly fertilized eggs were kept in RTOF and their development was followed by time-lapse imaging. (e) The times for the first, the second and the third cell division in RTOF treated and control (E3 treated) embryos. Error bars represent SD, *p < 0.05, **p < 0.01, ***p < 0.001.

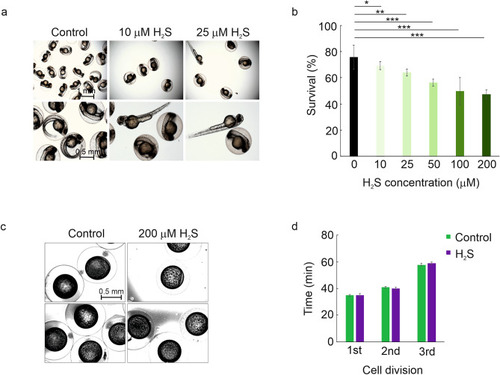
The effect of H2S treatment on the early development of zebrafish embryos. (a,b) H2S concentrations of 10–25 µM cause no changes in the morphology and minor decrease in the survival of zebrafish embryos, while the concentrations of 50–200 µM cause substantial increase in both the rate of malformation and mortality. Fertilized eggs were incubated in E3 water supplemented with 10–200 µM H2S for 48 h. The survival and well-being of the embryos was followed for 48 h and compared to E3 treated group (control). n(Control) = 397, n(10 µM) = 358, n(25 µM) = 310, n(50 µM) = 130, n(100 µM) = 182, n(200 µM) = 208. (c) Comparative developmental stages of control (E3 treated) and H2S treated embryos. Newly fertilized eggs were kept in E3 water with 200 µM H2S and the development was followed by time-lapse imaging. Two representative images are shown for both treatments (control images on the left, H2S treatment images on the right). (d) The times for the first, the second and the third cell division in H2S treated and control (E3 treated) embryos. Error bars represent SD, *p < 0.05, **p < 0.01, ***p < 0.001.

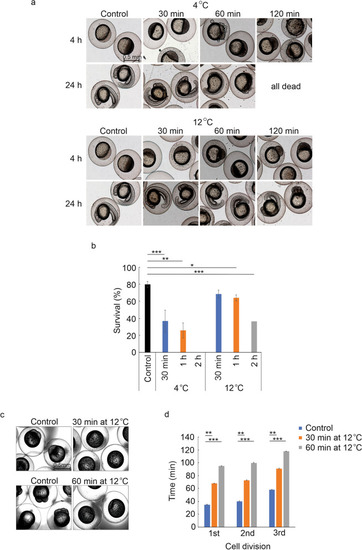
The effect of low temperatures on the early development of zebrafish embryos. (a,b) 30 min incubation of fertilized eggs in 4 °C causes developmental defects and increased mortality while the environmental temperature of 12 °C is better tolerated causing only moderate defects and mortality after 2 h incubation. Newly fertilized eggs were kept in E3 water at 4 °C or 12 °C for 30 min, 1 h or 2 h after which they were moved to 28 °C. The survival and well-being of the embryos was followed for 24 h and compared to control embryos kept in 28 °C throughout the experiment. Figures represent combined results from 3 independent experiments. n(control) = 353, n(30 min/4 °C) = 278, n(1 h/4 °C) = 335, n(2 h/4 °C) = 247, n(30 min/12 °C) = 384, n(1 h/12 °C) = 396, n(2 h/12 °C) = 323. (c) The comparative developmental stages of the control (E3 treated) and the cold treated embryos. Newly fertilized eggs were kept in 12 °C for 30 or 60 min and the development was followed by time-lapse imaging. (d) The times for the first, the second and the third cell division in cold treated (12 °C) and control (E3 treated) embryos. Time-lapse experiments were repeated twice. Error bars represent SD, *p < 0.05, **p < 0.01, ***p < 0.001).

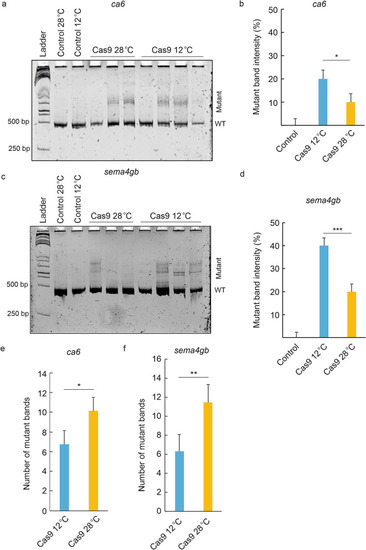
The effect of cold treatment on CRISPR/Cas9 mutagenesis efficiency in zebrafish embryos. Incubating zebrafish embryos in 12 °C immediately after Cas9/sgRNA injections increases the mutagenesis efficiency compared to embryos incubated in 28 °C. (a) Representative image of the heteroduplex motility assay (HMA) to analyze the mutagenesis efficiency of Cas9/sgRNA(ca6) injected embryos incubated in 12 °C versus 28 °C. The image shows the HMA result for one uninjected (control) embryo incubated in 28 °C, one uninjected embryo incubated in 12 °C, three Cas9/sgRNA(ca6) injected individuals incubated in 28 °C (Cas9 28 °C) and four Cas9/sgRNA(ca6) injected individuals incubated in 12 °C (Cas9 12 °C). (b) Mutant band intensities for control and Cas9/sgRNA(ca6) injected embryos. Figure represents combined results from 2 independent experiments, n(Cas9 12 °C) = 76, n(Cas9 28 °C) = 72, n(control 12 °C) = 54, n(control 28 °C) = 50. (c) Representative image of the heteroduplex motility assays (HMA) carried out to analyze the mutagenesis efficiency of Cas9/sgRNA(sema4gb) injected embryos incubated in 12 °C versus 28 °C. The image shows the HMA result for one uninjected (control) embryo incubated in 28 °C, one uninjected embryo incubated in 12 °C, three Cas9/sgRNA(sema4gb) injected individuals incubated in 28 °C (Cas9 28 °C) and four Cas9/sgRNA(sema4gb) injected individuals incubated in 12 °C (Cas9 12 °C). (d) Mutant band intensities for control and Cas9/sgRNA(sema4gb) injected embryos. Figure represents combined results from 2 independent experiments, n(Cas9/12 °C) = 68, n(Cas9/28 °C) = 66, n(control 12 °C) = 52, n(control 28 °C) = 48. (e) Number of mutant bands in 12 °C or 28 °C treated, Cas9/sgRNA(ca6) injected embryos, after heteroduplex formation, n(Cas9/12 °C) = 54, n(Cas9/28 °C) = 49. (f) Number of mutant bands in 12 °C or 28 °C treated, Cas9/sgRNA(sema4gb) injected embryos, after heteroduplex formation, n(Cas9/12 °C) = 52, n(Cas9/28 °C) = 47. Error bars represent SD, *p < 0.05, **p < 0.01, ***p < 0.001), WT Wild-type band.

Acknowledgments
This image is the copyrighted work of the attributed author or publisher, and ZFIN has permission only to display this image to its users. Additional permissions should be obtained from the applicable author or publisher of the image. Full text @ Sci. Rep.