FIGURE SUMMARY
Title

Functional Characterization of the N-Acetylmuramyl-l-Alanine Amidase, Ami1, from Mycobacterium abscessus

Authors
Küssau, T., Van Wyk, N., Johansen, M.D., Alsarraf, H.M.A.B., Neyret, A., Hamela, C., Sørensen, K.K., Thygesen, M.B., Beauvineau, C., Kremer, L., Blaise, M.
Source
Full text @ Cells

Generation and phenotypic analyses of Δami1Mab. (A) Schematic representation of the genomic region around ami1Mab (MAB_0318c) in the parental (WT) and Δami1Mab strains of Mycobacterium abscessus. The size of the PCR amplicons used for genotyping the Δami1Mab mutants is indicated. (B) PCR profile confirming the proper deletion of ami1Mab in the mutant strains. The PCR products of 1.6 kb were amplified from Δami1Mab genomic DNA from rough (R) and smooth (S) variants while a band at 2.4 kb is expected for the parental (WT) strain. (C) In vitro growth curves at 37 °C of the M. abscessus (Mab) WT, Δami1Mab, and complemented strains, in the R and S variants, respectively. Bacteria were grown in 7H9 broth supplemented with 10% oleic acid-albumin-dextrose-catalase (OADC) and 0.025% tyloxapol. The experiment is one representative of three replicates. (D) Transmission electron microscopy (TEM) of the M. abscessus WT, Δami1Mab, and complemented strain in the S morphotype. Septa are indicated by black arrows. (E) Cell length measurements from the TEM data. Mean cell length = 1.27 μm for Mab S WT (n = 518); mean cell length = 1.34 μm for Δami1Mab (n = 557); mean cell length = 1.27 μm from the complemented strain (n = 576), the scale bar represents 500 nm. For statistical analysis, an unpaired t-test with Welch’s correction was performed. p = 0.0035 for WT vs. Δami1Mab and p = 0.0053 for Δami1Mab vs. Δami1Mab complemented (compl.) n.s. stands non statistically significant and ** stands for p < 0.01.

Assessment of Δami1Mab in human macrophage and zebrafish larvae. (A) M. abscessus-infected THP-1 macrophages with amikacin maintained at 50 μg/mL in the RPMI medium were lysed from day 0 to day 5 for CFU enumeration. Bacteria were plated at day 0 (2–4 h phagocytosis followed by a 2 h amikacin treatment at 250 μg/mL) day 1, 3 and day 5. Histograms and error bars represent means and standard deviations calculated from three independent experiments. For statistical analysis, the unpaired t-test with Welch’s correction was applied. *, **, ***, and **** stand for p < 0.1, p < 0.01, p < 0.001, and p < 0.0001, respectively. Left and right panels are for M. abscessus S and R variants, respectively. The M. abscessus S and R wild-type strains used as controls were not transformed with pMV306. (B) Survival curves of zebrafish embryos infected with the different M. abscessus strains. The data shown are corresponding to a pool of data from three independent experiments. For each experiment, 20 embryos were injected with 200–300 CFUs, respectively. Left and right panels are for M. abscessus S and R variants, respectively. The M. abscessus S and R wild-type strains used as controls were transformed with pTEC27 but not transformed with pMV306. (C) Representative images of infected zebrafish embryos at 5 days post-infection. Scale bar represents 1 mm. Infection foci are displayed in red.

Biochemical characterization of Ami1Mab. (A) Ami1Mab elution profile on Superdex 75 10/300 GL size-exclusion chromatography column. The denaturating polyacrylamide electrophoresis gel attests to the high protein purity after three chromatography steps. (B) Schematic of the muramyl-dipeptide hydrolysis assay. Ami1Mab cleaves muramyl-dipeptide (MDP) to yield N-acetylmuramic acid (MurNAc) and l-Ala-d-IsoGln (dipeptide). (C) The thin-layer chromatography (TLC)-based activity assay revealed a correlation between the disappearance of MDP and the concentration of Ami1Mab. Pure MDP, MurNAc, and dipeptide (DP) were loaded on the right part of the TLC plate as migration controls. TLC was revealed by ninhydrin and charring. (D) The enzymatic activity of Ami1 is Zn2+-dependent. Activity of both Ami1Mab and Ami1Mtb is inhibited after incubation with EDTA.

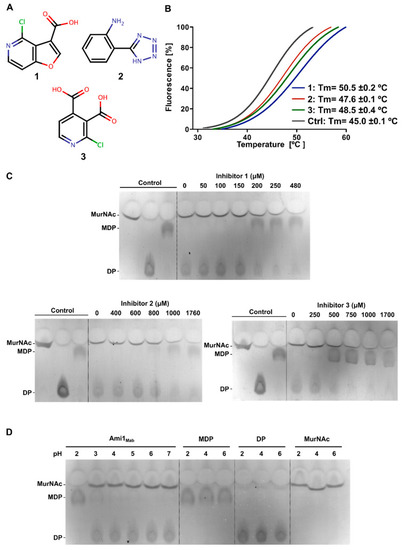
Characterization of Ami1Mab inhibitors. (A) Chemical structure of the three compounds selected by thermal-shift assay. Chloride atom is in green, carbon in black, oxygen in red and nitrogen in blue (B) Melting curves of Ami1Mab in the presence of compound 1 (blue) at 244 μM, compound 2 (red) at 879 μM, and compound 3 (blue) at 845 μM as compared with protein incubated with 5% DMSO (black). (C) Assessment of Ami1Mab inhibition by compounds 1, 2, and 3 by TLC. (D) Evaluation of the Ami1Mab activity over an acidic pH range.

Structural comparisons of the Ami1Mab, Ami1Mtb, and Ami1Msm. (A) Overall crystal structure of Ami1Mab (left), Ami1Msm (middle) and Ami1Mtb (PDB id: 4LQ6) (right). Each structure is shown as a cartoon representation and is colored differently and according to its secondary structures. α, β, and η indicate alpha-helices, beta-strands, and 310 helices, respectively. The catalytic zinc ion (Zn2+) appears as a wheat-colored sphere. (B) Fo-Fc simulated-annealed OMIT map. The electron density map as seen in the Ami1Mab:dipeptide co-crystal structure and surrounding l-Ala-d-IsoGln (yellow sticks) is displayed as a grey mesh and contoured at 3 σ level. (C) Close up of the active site of Ami1Mab as seen in the Ami1Mab: dipeptide co-crystal structure. l-Ala-d-IsoGln (yellow sticks) tightly interacts by H-bonding and salt-bridge as illustrated by the dashed lines. Water molecules appear as green spheres. (D) The figure shows the molecular interactions seen in the co-crystal structure of Ami1Mtb bound to dipeptide (PDB id: 4M6G). (E) Active site of the Ami1Msm.

In silico docking of the three inhibitors. The figure depicts the best docking poses of the three compounds. All three inhibitors appear able to bind in the Ami1Mab active site with similar binding energies. Inhibitors are displayed in stick representation. Nitrogen atoms are in blue, oxygen in red, hydrogen in white and carbon atoms in yellow for the ligand and grey for the protein.

Acknowledgments
This image is the copyrighted work of the attributed author or publisher, and ZFIN has permission only to display this image to its users. Additional permissions should be obtained from the applicable author or publisher of the image. Full text @ Cells