
- Title
-
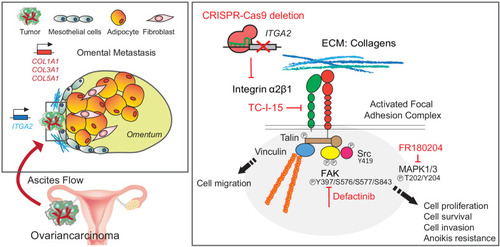
Collagen-rich omentum is a premetastatic niche for integrin α2-mediated peritoneal metastasis
- Authors
- Huang, Y.L., Liang, C.Y., Ritz, D., Coelho, R., Septiadi, D., Estermann, M., Cumin, C., Rimmer, N., Schötzau, A., Núñez López, M., Fedier, A., Konantz, M., Vlajnic, T., Calabrese, D., Lengerke, C., David, L., Rothen-Rutishauser, B., Jacob, F., Heinzelmann-Schwarz, V.
- Source
- Full text @ Elife

(A) Proteomic analysis identifies up- and downregulated ECM-associated proteins in omental metastasis versus normal omentum tissue (n = 8). Representative immunohistochemical staining of normal and metastatic omentum for COL1A1. Scale bar 50 μm. (B) Forest plots of the expression of collagens (COL1A1, COL3A1, and COL5A1) as univariate predictors of overall survival, using the curatedOvarianData (n = 2970) applicable expression and survival information. Hazard ratio (HR) significantly larger than one indicates positive correlation to poor outcome in EOC patients. (C) Box-whisker plots of top 25 collagens gene set variation analysis (GSVA) in 20 non-diseased tissues from GTEx RNA-seq dataset. (D) A schematic figure of integrin receptors and their corresponding ECM ligands. (E) Representative western blot shows the expression of collagen-binding integrins α1, α2, α10, α11, as well as integrin α5 and β1 in omental metastasis and normal omentum. Bar charts with relative integrin expression as mean ± SD (**p<0.05, ***p<0.001; n = 13–19). (F) Representative immunofluorescence images with membranous E-cadherin (green) and ITGA2 (red) staining in ATCs. Pie chart summarizes percentage of ITGA2+ tumor spheroids from EOC patients (n = 15). Scale bar 50 μm. (G) Western blot analysis of ITGA2 and E-cadherin expression in matched EOC patient samples, ascites (AS), primary (OV) and omental metastasis (OM). |

( |

Unsupervised hierarchical cluster analysis and heat map visualization for expression of collagen-encoding genes among EOC cell lines (n = 47) and human fibroblast derived from various tissue origins (n = 37) using the CCLE dataset. |

( |

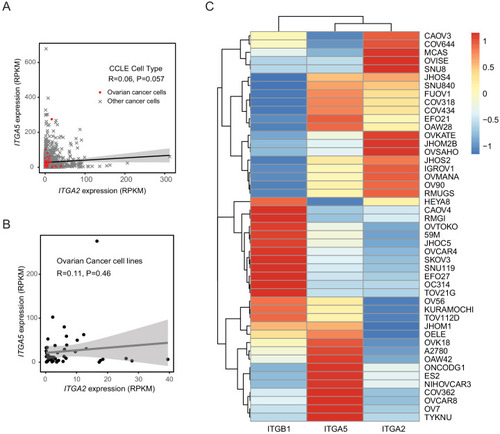
(A) Hierarchical cluster analysis and heat map visualization of known collagen-binding integrin-encoding genes among EOC cell lines using the Cancer Cell Line Encyclopedia (CCLE). The original histological subtypes and TP53 genomic mutation status were annotated as previously described (Domcke et al., 2013). (B) Representative western blot showing expression of collagen-binding integrins among eleven EOC cell lines. (C) ITGA2 expression (Spearman correlation R = −0.0012, p=0.99) is independent of histological subtypes and previously described serous suitability scores (Domcke et al., 2013). Representative EOC cell lines used in this study are annotated. (D) CRISPR-Cas9 mediated deletion of ITGA2 targeting exon 29–30, resulting in a 743 and 747 bp genomic deletion. (E) Immunoblot confirms loss of ITGA2 expression in five of ΔITGA2 (KO) cell lines while the binding partner ITGB1 was not altered. (F) Bar chart showed the median fluorescence intensity of ITGA2 expression in WT and ΔITGA2 cells by flow cytometry. (G) Representative fluorescence images with membranous ITGA2 expression in WT and ΔITGA2 cancer spheroids collected from ultra-low attachment plate. Scale bar 100 μm. |

( |

( |

(A) Cell proliferation index of WT and ΔITGA2 cells in collagen-coated plate. (B) Anchorage-dependent colony formation assay for WT and ΔITGA2 cells on collagen-coated plate after 7 days incubation. Bar chart represents the mean ± SD of total colony counts. (C) Chemotaxis cell migration assay and quantification of cell migration (24 hr). Scale bar 200 μm. (D) Cell detachment-induced apoptosis (anoikis) assay. WT and ΔITGA2 cells stained with Annexin V-FITC and DAPI after 3–5 days of cultivation in ultra-low attachment plate to identify apoptotic dead cells (FITC+/DAPI+). Mean ± SD (*p<0.05) from two independent experiments. (E) Western blot shows increased cleaved PARP in the KO compared to WT cells under non-adherent spheroid condition. (F) Scheme of tumor cells transplant model in Tg(kdrl:eGFP) zebrafish. CM-Dil labeled cancer cells were transplanted into zebrafish at two dpf (days post fertilization). (G) At five dpf, fish were enzymatically dissociated to single cells and analyzed in vivo survival of cancer cells by flow cytometry. Representative counter plot shows the percentage of CM-Dil+ cancer cells. Bar chart summarizes data from n = 5 fish per group. (H) Representative confocal images of transplanted fish (n = 5 per group) showing the tumor cluster formation in proximity of the circulatory loop (white arrow) at five dpf. Scale bar 100 μm. (I) Numbers of cluster formation and (J) single cells in tail vein were counted and represented as mean ± SD (unpaired Student’s t-test, *p<0.05). |

( |

(A) Static cancer cell-ECM adhesion assay. Representative images showing OVCAR3 WT and ΔITGA2 cell adhesion to different ECM proteins, including collagen type I, III, IV, laminin, and fibronectin. (B) Bar charts with mean ± SD of the percentage of cell adhesion efficiency of OVCAR3, SKOV3, and IGORV1 cells from three independent experiments. (unpaired Student’s t-test, ***p<0.001) (C) Representative images and bar charts showing the cell adhesion to collagen I in four ITGA2-overexpressed EOC cell lines (unpaired Student’s t-test, ***p<0.001). Scale bar 200 μm. (D) Single cell adhesion on bioprinted collagen was monitored by time-lapse microscopy. Data represent the surface area ratio as mean ± SD (n > 300 single cells were analyzed per group). (E) Representative scanning electron microscope (SEM) images showing the SKOV3 WT and ΔITGA2 cellular adherence on bioprinted collagen at 1, 6, and 24 hr. White arrow indicates the polarized filopodia structure. Scale bar 10 μm. (F) Velocity and displacement of single cells on collagen-coated slides were measured (n > 300 per group from three independent experiments. Unpaired Student’s t-test, *p<0.05, ***p<0.001). |

( |

(A) Flow cytometry analysis of ITGA2 and ITGA5 expression from patient-derived ATCs. (B) Pearson’s correlation of ITGA2 or ITGA5 expression and cell-to-collagen/fibronectin adhesion efficiency (n = 10). (C) ATC adhesion to collagen and fibronectin was performed after 20 mins pretreatment of 1 μM TC-I-15 or DMSO as control. Representative images show that TC-I-15 inhibits primary ATCs adhesion to collagen I but not fibronectin. (D) Box-whisker plots show the percentage of ATCs adhesion efficiency to collagen and fibronectin, respectively. (unpaired Student’s t-test, ***p<0.001). (E) Percentage of IGROV1 cell-ECM adhesion with (+) or without (-) 20 mins pretreatment of TC-I-15. (F) Anchorage-independent cell growth in the presence or absence of TC-I-15 inhibitor for 10 days (TC-I-15 containing medium was refreshed every 2 days). Bar chart shows the mean ± SD of spheroid diameters and spheroid number counts (***p<0.001) in IGROV1 WT and ΔITGA2 cells. Scale bar 100 μm. |
Spearman’s correlation coefficient in scatter plot showing |

( |
( |
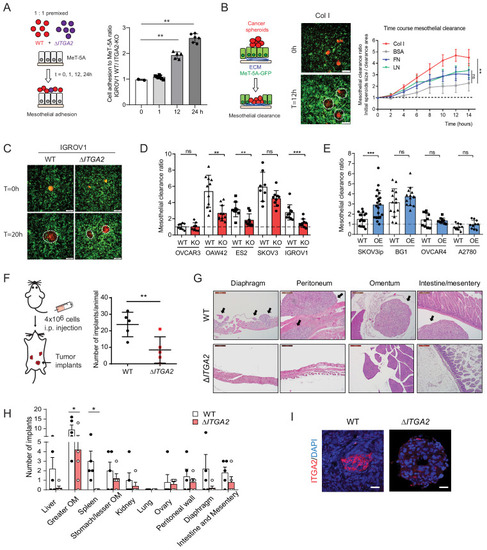
(A) Cancer cell-mesothelial adhesion assay was performed by seeding equal numbers of fluorophore-labeled WT and ΔITGA2 single cancer cells on a confluent monolayer of MeT-5A cells. Bar chart shows the adhesion ratio of WT vs ΔITGA2 to MeT-5A cells at different time points. (B) Stable RFP-expressing cancer cell spheroids were seeded on top of a GFP-expressing MeT-5A mesothelial monolayer pre-coated with different ECM substrates. Mesothelial clearance activity was measured over time by time-lapse microscopy. Clearance ratio >1 suggests active enhanced clearance activity. Scale bar 200 μm. Line chart summarizes mesothelial clearance activity on different ECM substrates over time. (C) Representative images of mesothelial clearance assay of SKOV3 WT and ΔITGA2 cancer cell line at time point 0 and 20 hr. Scale bar 200 μm. (D) Bar chart shows mesothelial clearance ratio for WT versus ΔITGA2 (n = 5) and (E) WT versus ITGA2-overexpressed (OE) (n = 4) EOC cell lines with mean ± SD (unpaired Student’s t-test, ***p<0.001), each dot represents single spheroid clearance activity. (F) Dot plot shows the total number of tumor implants per animal after 8 weeks intraperitoneal injection of 4 × 10⁶ SKOV3 WT and ΔITGA2 cells in NIH(S)II: nu/nu mice. (G) Representative H and E staining of the xenografts and metastases. Black arrows indicate the tumor metastases. Scale bar 200 μm. (H) Bar chart summarized the number of tumor foci in different organs. Mean ± SD (One-way Anova, *p<0.05). (I) Representative immunofluorescence staining of ITGA2 expression in the omental tumor xenograft. |

( |

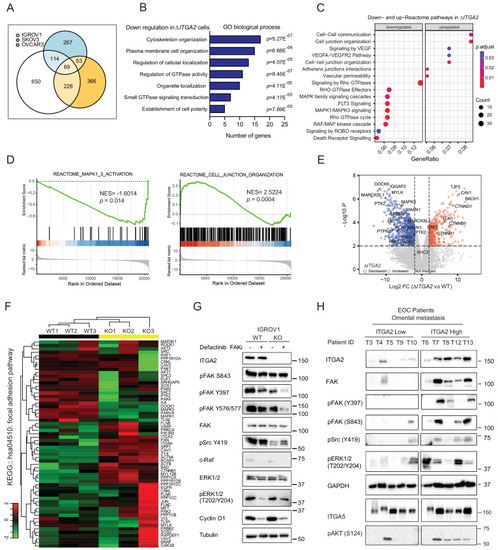
Immunoblot analysis shows downregulation of FAK and MAPK(ERK1/2) phosphorylation in WT and |

( |
|