Individual sheath extension rates and pruning frequencies are axon subtype-specific.a-b Lateral view images of the larval spinal cord show sheath extension (a) and sheath pruning (b) during a 3-h time course. Transgenic reporter expression (indicated) marks individual axons or oligodendrocyte membranes. Dashed lines illustrate individual sheath lengths and arrowheads denote sheath pruning events. Images are confocal maximum z-projections with dorsal up and anterior left. Scale bar = 3 μm. c-d Plots show mean growth rates (c) and distributions of individual sheath growth rates (d). For (c), error bars represent the mean ± SEM. For (d), the y-axis approximates the density of data points that exhibited the corresponding growth rate. Larger y-values represent a larger proportion of data points exhibiting this growth rate. Black ticks indicate medians. n (# of sheaths) = 24 (phox2b+), 43 (tbx16+), 36 (pitx2c+), 37 (isl1[ss]+). e Quantification of the percentage of total sheaths that pruned during a 3-h time course grouped by axon subtype. n (sheaths) = 29 (phox2b+), 43 (tbx16+), 38 (pitx2c+), 37 (isl1[ss]+). Overall chi-square test of difference in percent pruning = 0.0025. Pairwise p-values were generated using Dunn’s multiple comparisons (c) or using Tukey-adjusted pairwise comparisons (e)
Individual axon subtypes support differential initial ensheathment rates.a-b Lateral view images show the progression of myelination on individual spinal axons during the 48-h period following initial wrapping. Images were acquired within a constant spinal cord segment at each time point. Note that although RB and CoPA spinal axons are both located within the spinal cord DLF, RB sensory axon myelination remained sparse and incomplete (a), but CoPA axons became completely ensheathed during the same imaging period (b). Scale bar = 5 μm. c Quantification of the percent length of individual axons ensheathed at each time point. t = 0 was defined as the onset of initial wrapping for each subtype within the spinal cord segment imaged (see Methods). Each row of the table contains two dots indicating the subtypes being compared with the corresponding p-value testing for difference in myelination rates of those two subtypes. For the right-most column, c reports p-values for the indicated axon diameter comparisons using one-way ANOVA and Tukey post-test. Note that subtype comparisons lacking significant differences in axon diameter did show significant differences in myelination rate. Error bars represent the mean ± SEM. n (# larvae imaged at 0, 24, 48 h time points) = 11, 14, 25 (tbx16+); 15, 12, 6 (phox2b+); 11, 11, 18 (pitx2c+); 16, 25, 23 (isl1[ss]+). P-value from ANCOVA testing for overall difference in myelination rate was 0.0015. Reported p-values for pairwise comparisons were generated with Tukey adjustment
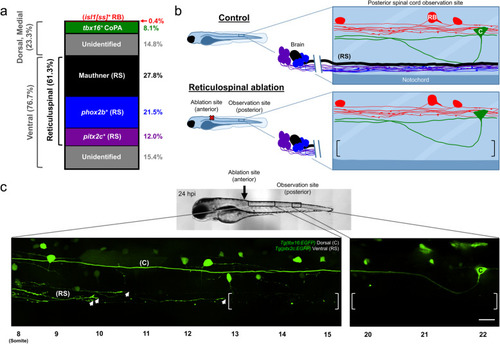
Reticulospinal ablation creates a target axon-deficient environment.a Stacked bar graph represents the proportion of myelin dedicated to transgene-labeled subtypes in the posterior spinal cord. n (larvae) = 10 (isl1[ss]+), 7 (tbx16+), 13 (Mauthner), 10 (phox2b+), 8 (pitx2c+). b Schematic depicting reticulospinal ablation. RB, C, and (RS) mark isl1[ss]+ RB cell bodies, tbx16+ CoPA cell bodies, and reticulospinal axons, respectively. Brackets enclose an area devoid of reticulospinal axons in ablated animals. c Lateral view images of the larval spinal cord acquired at 24 hpi (96 hpf) show severed, regenerating pitx2c+ axons alongside Wallerian degeneration of their former distal axon segments (left brackets). Arrowheads indicate growth cones of regenerating pitx2c+ axons, and brackets enclose areas devoid of reticulospinal axons. Note that severed axons never regenerated into posterior observation segments within 24 h of injury. Therefore, the posterior observation site lacked pitx2c+ descending reticulospinal axons, but possessed tbx16+ CoPA ascending local spinal interneurons. Images are tiled confocal maximum z-projections with dorsal up and anterior left. Scale bar = 20 μm
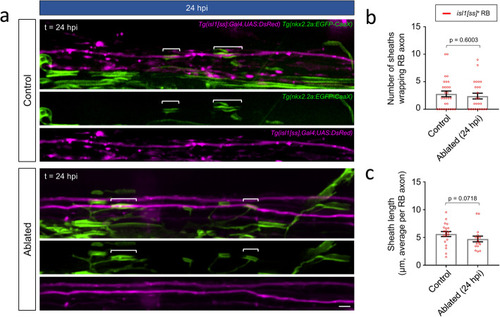
RB spinal sensory neuron axons maintain minimal ensheathment in a target axon-deficient environment.a Lateral view images of the posterior spinal cord show ensheathment of RB sensory axons in control (non-injured siblings) and ablated larvae (24 hpi, 96 hpf). Note that oligodendrocytes had not yet formed sheaths within this spinal cord segment at the time of ablation, and therefore all sheaths observed in the ablated group were formed in a reticulospinal axon-devoid environment. Brackets indicate individual sheaths wrapping RB axons. Scale bar = 5 μm. b Quantification of RB axon ensheathment. Scatter plot points represent the total number of sheaths wrapping isl1[ss]:DsRed+ RB axons in the posterior spinal cord of individual larvae (posterior to somite 2). n (larvae) = 29 (control), 25 (ablated). c Quantification of average sheath lengths. Scatter plot points represent the average length of all sheaths wrapping RB axons within an individual larva. n (larvae, total sheath #) = 20, 80 (control) and 16, 60 (ablated). For b-c, error bars represent mean ± SEM and p-values report Mann-Whitney test
CoPA spinal interneuron axons maintain a constant ensheathment rate in a target axon-deficient environment.a Lateral view images of the posterior spinal cord show ensheathment of CoPA axons in control (non-injured siblings) and ablated larvae. The indicated time points (24 and 36 hpi) were acquired at 72 and 84 hpf, respectively, and acquired in a constant spinal cord segment (somites 16–17). Note that ablation was performed prior to the initiation of oligodendrocyte differentiation and axon wrapping (48 hpf), and therefore all sheaths observed and counted formed after ablation of descending reticulospinal axons. Brackets indicate individual sheaths wrapping CoPA axons. Scale bar = 2 μm. b-d Quantification of CoPA axon ensheathment (b-c) and overall sheath lengths (d). Scatter plot points represent measurements of individual axons (b-c) or total number of sheaths wrapping tbx16+ CoPA axons (d) and error bars represent the mean ± SEM. n (larvae, total sheath #) = 28, 94 (control 24 hpi); 16, 53 (ablated 24 hpi); 23, 99 (control 36 hpi); 20, 92 (ablated 36 hpi). Reported p-values were generated using a two-tailed, unpaired t-test to compare groups at matched time points
Acknowledgments
This image is the copyrighted work of the attributed author or publisher, and
ZFIN has permission only to display this image to its users.
Additional permissions should be obtained from the applicable author or publisher of the image.
Full text @ Neural Dev.
Your Input Welcome
Thank you for submitting comments. Your input has been emailed to ZFIN curators who may contact you if
additional information is required.
Oops. Something went wrong. Please try again later.