
- Title
-
The zinc transporter ZIP9 (Slc39a9) regulates zinc dynamics essential to egg activation in zebrafish
- Authors
- Converse, A., Thomas, P.
- Source
- Full text @ Sci. Rep.
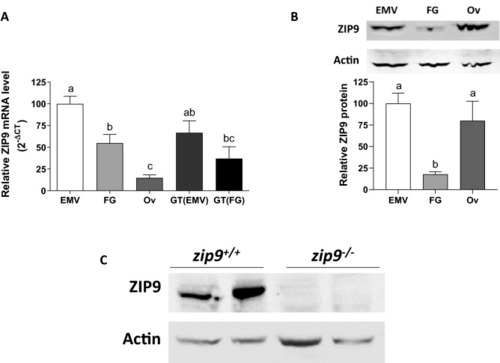
ZIP9 expression in the zebrafish ovary. |
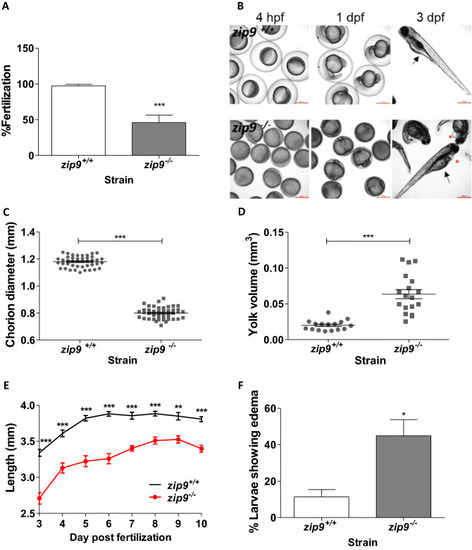
Characterization of |
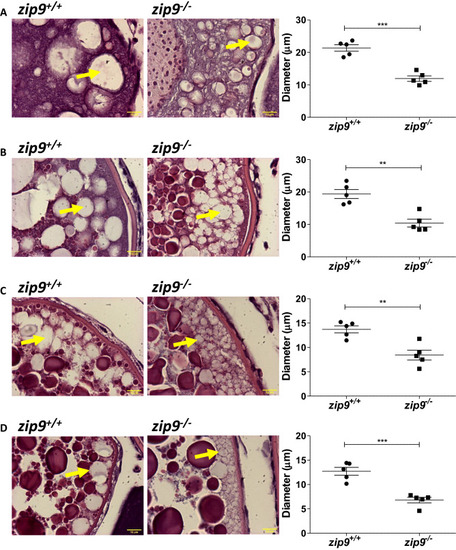
Morphology of cortical vesicles of PHENOTYPE:
|
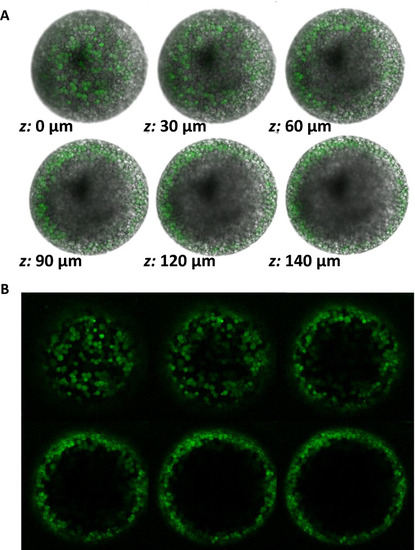
Meiosis II-arrested wildtype zebrafish eggs have cortically-localized, zinc-containing vesicles. |
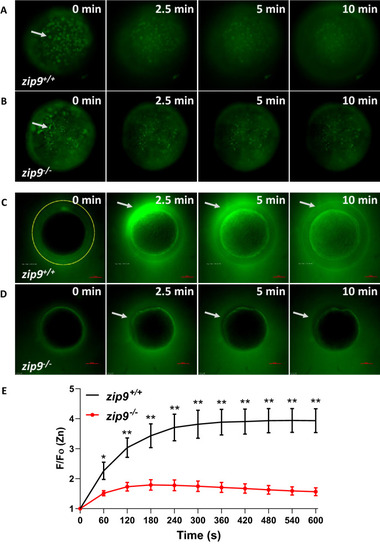
Zinc is stored in cortically-localized vesicles that undergo exocytosis upon egg activation. PHENOTYPE:
|
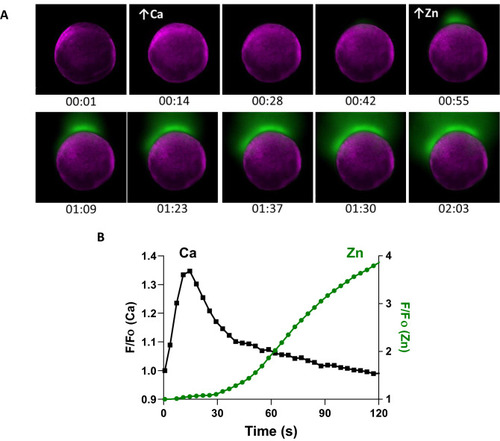
A rise in intracellular calcium proceeds zinc exocytosis in WT eggs. |
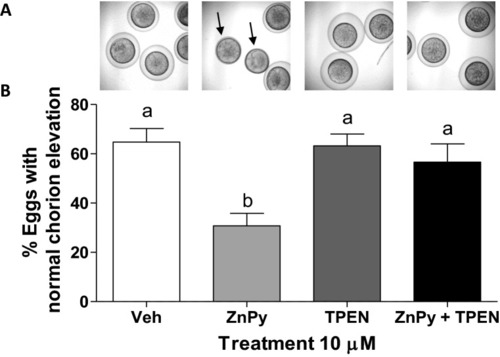
Effect of sustained zinc elevation on chorion elevation. PHENOTYPE:
|