
- Title
-
Cell type specific gene expression profiling reveals a role for complement component C3 in neutrophil responses to tissue damage
- Authors
- Houseright, R.A., Rosowski, E.E., Lam, P.Y., Tauzin, S.J.M., Mulvaney, O., Dewey, C.N., Huttenlocher, A.
- Source
- Full text @ Sci. Rep.
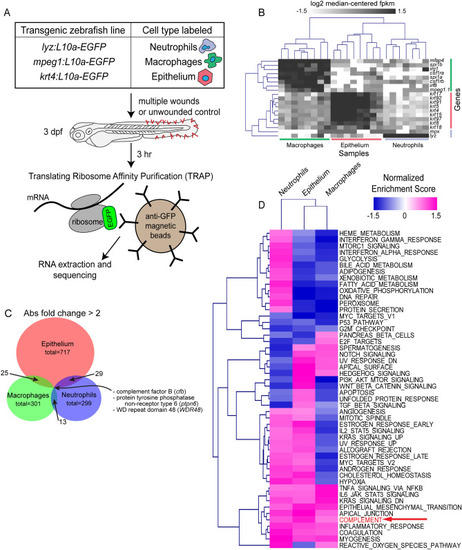
TRAP-RNAseq identifies differential expression of genes by neutrophils, macrophages, and epithelial cells in response to wounding. ( |

TRAP-RNAseq identifies upregulation of the complement pathway and EXPRESSION / LABELING:
PHENOTYPE:
|
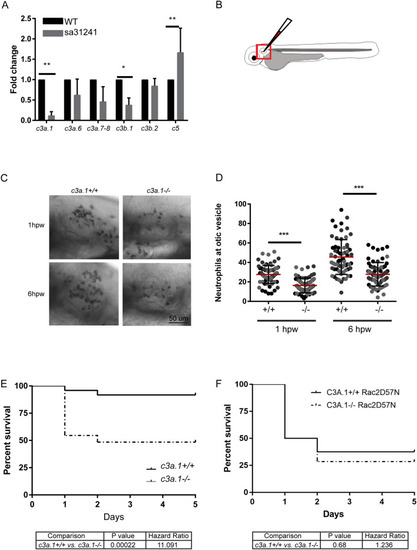
Global depletion of EXPRESSION / LABELING:
PHENOTYPE:
|
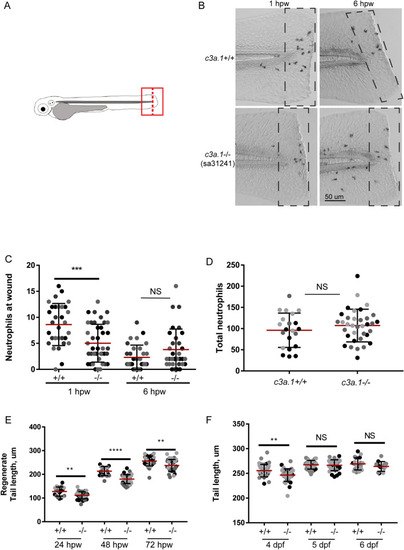
Global depletion of PHENOTYPE:
|
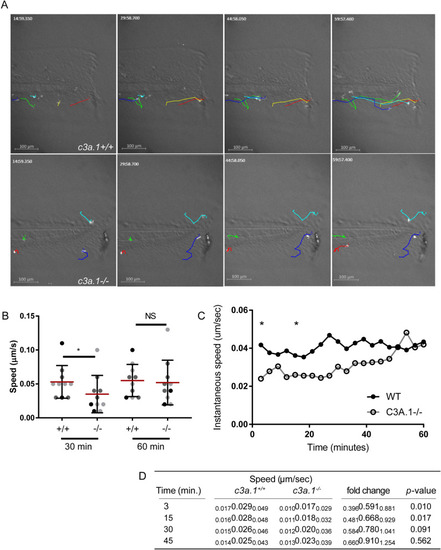
Loss of PHENOTYPE:
|