FIGURE SUMMARY
Title

Astrocytes influence medulloblastoma phenotypes and CD133 surface expression

Authors
Gronseth, E., Gupta, A., Koceja, C., Kumar, S., Kutty, R.G., Rarick, K., Wang, L., Ramchandran, R.
Source
Full text @ PLoS One

Astrocyte secreted factors alter Daoy MB cell gene expression, adhesion and invasion.

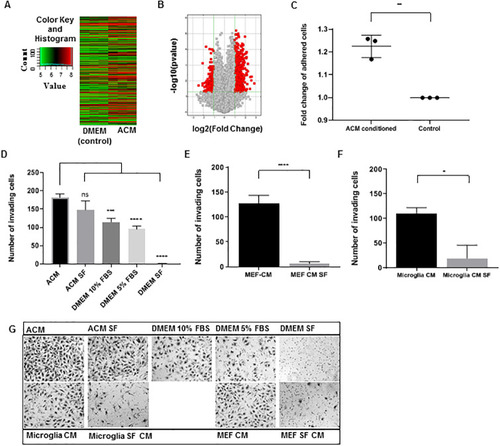
(A) Hierarchical clustering heat map of differentially expressed genes in Astrocyte Conditioned Media (ACM) cultured cells compared to DMEM cultured (control) cells. Image modified from Arraystar (Rockville, MD) (B) Volcano plot of differentially expressed genes between ACM cultured and control cells. The y-axis represents the–log10 of the p-value while the x-axis represents the log2 of gene expression fold change. All differentially expressed genes are shown as squares, with the red squares representing the differentially expressed genes (≥2 fold up or down) with statistical significance (p≤0.05) in ACM cultured cells. Image modified from Arraystar (Rockville, MD) (C) Fold change of the number of adhered cells per image in ACM conditioned cells compared to control (DMEM cultured, set to 1). (D-E) Average number of invaded Daoy cells per image, counted on the lower surface of Boyden chambers, with the respective media in the lower well during incubation. (F) Representative images of invaded cells on the lower surface of the Boyden chambers. Quantified values expressed as mean +/- SD. *p<0.05, **p<0.01, ***p<0.001, ****p<0.0001.

ACM conditioning changes Daoy MB cell morphology <italic>in vivo</italic>.

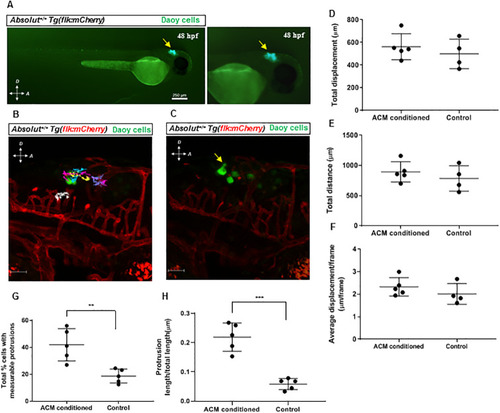
(A) Representative images of cells (yellow arrow) after injection into the hindbrains of 48 hpf Absolut+/+Tg(flk:mCherry) zebrafish embryos. Right panel is higher magnification. Scale bar is 250 μm. (B) Representative image of injected cells at the beginning of the time-lapse imaging. Colored lines show the tracked movement of individual cells during the time-lapse imaging, and the white line shows the tracked reference point movement. Scale bar is 50 μm. (C) Representative image of injected cell protrusion (yellow arrow). Scale bar is 50 μm. (D-F) Quantification of injected cell migration, represented by total cell displacement (D) and total distance (E) moved by all cells in first 12.5 hours (h) of imaging, and average displacement/frame (F) of cells through entire 24 h time lapse. (G-H) Quantification of injected Daoy cell protrusion formation, measured by average percent of visible cells with protrusions (G) and protrusion length to cell body size ratio (H). Quantified values expressed as mean +/- SD. **p<0.01, ***p<0.001.

EXPRESSION / LABELING:
Gene:
Fish:
Anatomical Term:
Stage: Long-pec

ACM effects on CD133 surface expression and neurosphere formation.

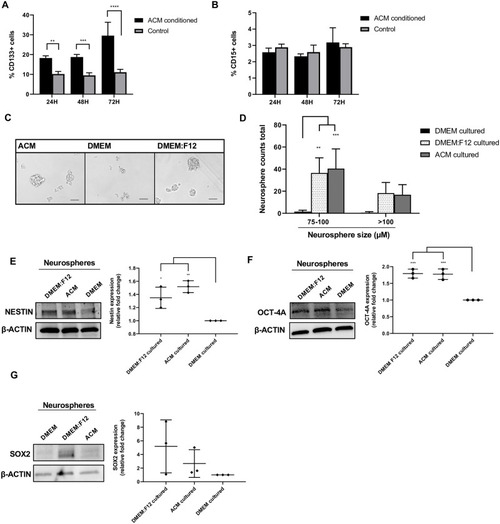
(A) Percentage of CD133 positive cells cultured in ACM or DMEM (control), measured by flow cytometry at 24, 48, and 72 h. (B) Percentage of CD15 positive cells cultured in ACM or DMEM (control), measured by flow cytometry at 24, 48, and 72 h. (C) Representative images of Daoy cells cultured in neurosphere conditions using the respective media for 48 h. Scale bar is 100 μm. (D) Total number of neurospheres counted in all images between 75–100 μm or >100 μm at 48 h, cultured in the respective media. (E) Western blot analysis of Nestin, (F) Oct-4A and (G) Sox2 expression in respective neurosphere culturing conditions at 48 h. β-actin served as a loading control (left). Quantification of relative fold change of Nestin, Oct-4A and Sox2 expression, measured by the densitometry of western blot bands and normalized to β-actin (DMEM condition set to 1) (right). Quantified values expressed as mean +/- SD. *p<0.05, **p<0.01, ***p<0.001, ****p<0.0001.

Short interfering RNA (siRNA) knockdown of <italic>CD133</italic> alters Daoy MB cell function.

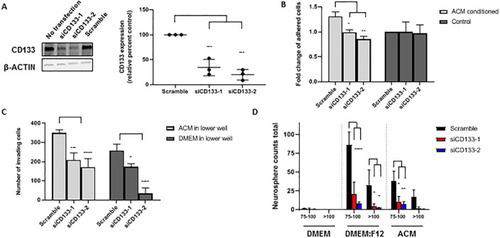
(A) Western blot analysis of CD133 expression 48 h after transfection with siCD133-1, siCD133-2, scramble siRNA, or no transfection. β-actin served as a loading control (left). Quantification of relative percent CD133 expression, measured by the densitometry of western blot bands and normalized to β-actin (Scramble set to 100%) (right). (B) Fold change of the number of adhered cells per image after transfecting with siCD133-1, siCD133-2 or scramble siRNA, then culturing in ACM or DMEM (control) (DMEM scramble set to 1). (C) Average number of invading cells per image, counted on the lower surface of Boyden chambers with ACM or DMEM in the lower well, after transfecting with siCD133-1, siCD133-2 or scramble siRNA. (D) Total number of neurospheres counted with diameter length between 75–100 μm or >100 μm. Cells were transfected with siCD133-1, siCD133-2 or scramble siRNA and then cultured in the respective media for 48 h. Quantified values expressed as mean +/- SD. *p<0.05, **p<0.01, ***p<0.001, ****p<0.0001.

Acknowledgments
This image is the copyrighted work of the attributed author or publisher, and ZFIN has permission only to display this image to its users. Additional permissions should be obtained from the applicable author or publisher of the image. Full text @ PLoS One