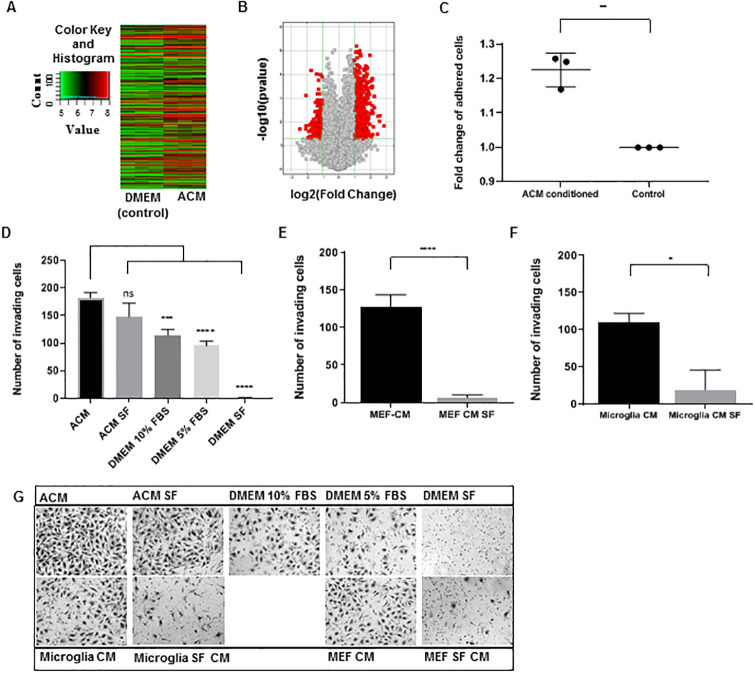
IMAGE

Fig 1

ID
ZDB-IMAGE-201003-220
Source
Figures for Gronseth et al., 2020
Image
Figure Caption

Fig 1 Astrocyte secreted factors alter Daoy MB cell gene expression, adhesion and invasion.

(A) Hierarchical clustering heat map of differentially expressed genes in Astrocyte Conditioned Media (ACM) cultured cells compared to DMEM cultured (control) cells. Image modified from Arraystar (Rockville, MD) (B) Volcano plot of differentially expressed genes between ACM cultured and control cells. The y-axis represents the–log10 of the p-value while the x-axis represents the log2 of gene expression fold change. All differentially expressed genes are shown as squares, with the red squares representing the differentially expressed genes (≥2 fold up or down) with statistical significance (p≤0.05) in ACM cultured cells. Image modified from Arraystar (Rockville, MD) (C) Fold change of the number of adhered cells per image in ACM conditioned cells compared to control (DMEM cultured, set to 1). (D-E) Average number of invaded Daoy cells per image, counted on the lower surface of Boyden chambers, with the respective media in the lower well during incubation. (F) Representative images of invaded cells on the lower surface of the Boyden chambers. Quantified values expressed as mean +/- SD. *p<0.05, **p<0.01, ***p<0.001, ****p<0.0001.

Acknowledgments
This image is the copyrighted work of the attributed author or publisher, and ZFIN has permission only to display this image to its users. Additional permissions should be obtained from the applicable author or publisher of the image. Full text @ PLoS One