FIGURE SUMMARY
Title

Systems genetics analysis identifies calcium-signaling defects as novel cause of congenital heart disease

Authors
Izarzugaza, J.M.G., Ellesøe, S.G., Doganli, C., Ehlers, N.S., Dalgaard, M.D., Audain, E., Dombrowsky, G., Banasik, K., Sifrim, A., Wilsdon, A., Thienpont, B., Breckpot, J., Gewillig, M., Competence Network for Congenital Heart Defects, Germany, Brook, J.D., Hitz, M.P., Larsen, L.A., Brunak, S.
Source
Full text @ Genome Med.

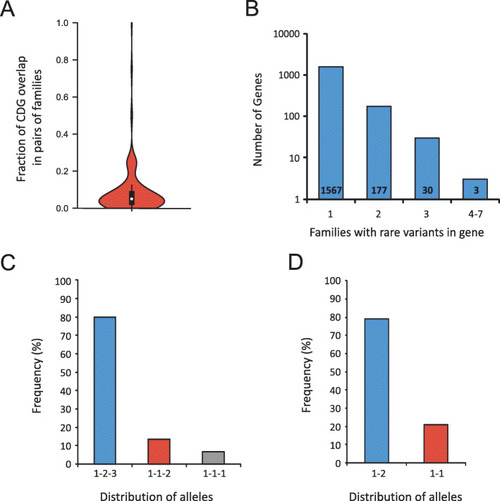
Distribution of candidate disease genes and variants across families. a Overlap between CDGs in pairs of families. b Distribution of CDGs across families. The number of CDGs found in one, two, three, and 4–7 families is shown. c Distribution of alleles in CDGs found in three families (1-2-3, three different alleles; 1-1-2, two different alleles; 1-1-1, same allele found in all three families). d Distribution of alleles in CDGs shared in two families (1-2, different alleles; 1-1, same allele).

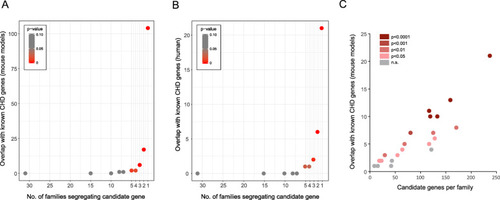
Enrichment of CHD genes in candidate disease genes. Overlap between CDGs and known CHD genes from mouse models (a) and patients (b). The number of overlapping genes is plotted against the number of families the CDGs were found in. c The number of overlapping genes (mouse models) per family. Statistical significance of the overlap is indicated by color code (red colors, significant; gray color, not significant (n.s.))

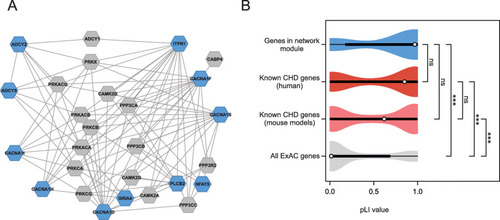
Identification of a calcium-signaling network affected by rare mutations identified in CHD families. a Network module of CDGs (blue) and their interaction partners (gray). The module accommodates more CDGs than expected by chance (adjusted p value 0.0033). Proteins are shown as hexagons; protein interactions are shown with lines. b Violin plots of distributions of pLI scores in genes encoding the 27 proteins in the network module (upper, blue), known CHD genes from patients and mouse models (middle, red and pink, respectively), and all 18,225 genes listed in ExAC with a calculated pLI score (lower, gray).***p < 0.001. ns, not significant (Kruskal-Wallis one-way analysis of variance on ranks)

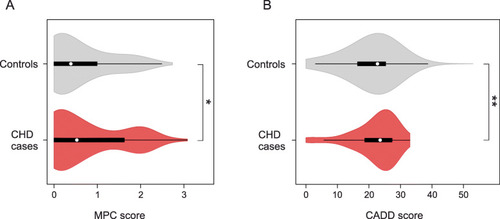
Distribution of MPC and CADD scores of rare variants in 714 CHD cases and 4922 controls. Protein altering and truncating variants (PAV and PTV) with MAF < 0.001 identified in the genes ADCY2, ADCY5, CACNA1D, CACNA1H, CACNA1I, CACNA1S, GRIA4, ITPR1, NFAT5, and PLCB2 were scored using MPC score [22] (a) or CADD score [21] (b). NCHD = 136 variants. NControls = 982 variants. Difference between median values of controls and cases was determined using a Mann-Whitney rank-sum test. **p < 0.01, *p < 0.05

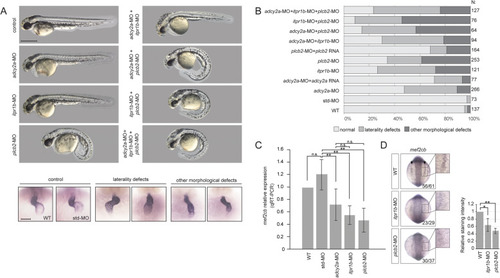
Functional validation of candidate genes in zebrafish. a Phenotype of controls and morphants. Single genes and combinations of genes targeted by splicing morpholinos are indicated on the left. Upper panels: gross appearance of 48 hpf zebrafish embryos. Lower panel: examples of cardiac phenotypes of 48 hpf wt, control, and morphant embryos. Hearts were visualized by ISH with a probe against the cardiac marker myl7. b Quantification of phenotypes in wt, controls, morphants, and mRNA rescued morphants. Note the combinatorial effects on cardiac phenotypes when more than one gene is affected. c, d Expression of mef2cb in 10 somite stage zebrafish embryos, analyzed by qRT-PCR (c) and ISH (d). ISH staining intensity was quantified and analyzed using Student’s T test. *p < 0.05, **p < 0.01

ZFIN is incorporating published figure images and captions as part of an ongoing project. Figures from some publications have not yet been curated, or are not available for display because of copyright restrictions.

Acknowledgments
This image is the copyrighted work of the attributed author or publisher, and ZFIN has permission only to display this image to its users. Additional permissions should be obtained from the applicable author or publisher of the image. Full text @ Genome Med.