IMAGE

Fig. 3

ID
ZDB-IMAGE-200901-3
Source
Figures for Izarzugaza et al., 2020
Image
Figure Caption

Fig. 3

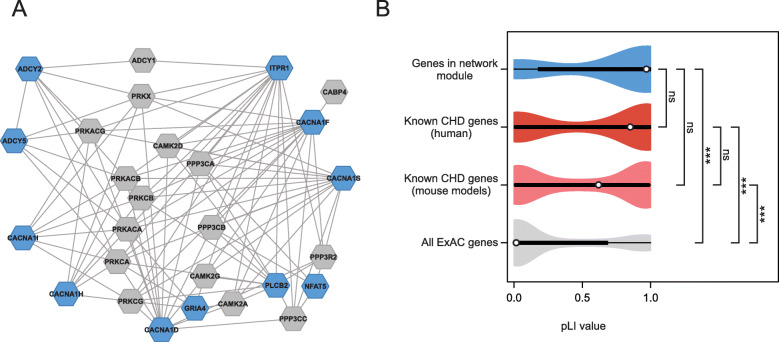
Identification of a calcium-signaling network affected by rare mutations identified in CHD families. a Network module of CDGs (blue) and their interaction partners (gray). The module accommodates more CDGs than expected by chance (adjusted p value 0.0033). Proteins are shown as hexagons; protein interactions are shown with lines. b Violin plots of distributions of pLI scores in genes encoding the 27 proteins in the network module (upper, blue), known CHD genes from patients and mouse models (middle, red and pink, respectively), and all 18,225 genes listed in ExAC with a calculated pLI score (lower, gray).***p < 0.001. ns, not significant (Kruskal-Wallis one-way analysis of variance on ranks)

Acknowledgments
This image is the copyrighted work of the attributed author or publisher, and ZFIN has permission only to display this image to its users. Additional permissions should be obtained from the applicable author or publisher of the image. Full text @ Genome Med.