
- Title
-
Newly identified Gon4l/Udu-interacting proteins implicate novel functions
- Authors
- Tsai, S.M., Chu, K.C., Jiang, Y.J.
- Source
- Full text @ Sci. Rep.
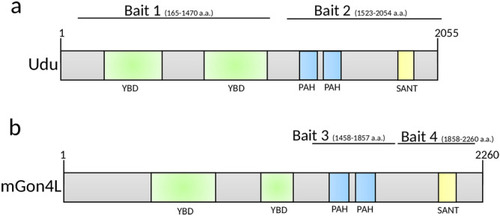
Schematic structures of the bait proteins. Domain structures of ( |
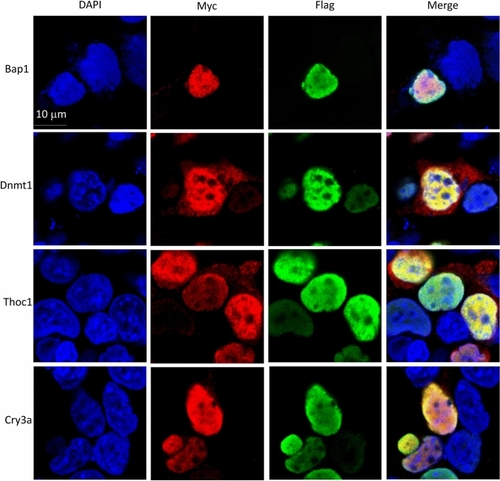
Confocal images for the cellular co-localization analysis of Udu and its interacting proteins. For co-localization analysis, Flag-tagged Udu-P/S construct was co-transfected individually with each Myc-tagged construct, including Bap1, Dnmt1, Thoc1, and Cry3a. Anti-FLAG M2 monoclonal antibody and rabbit anti-MYC antibody were used. Alexa Fluor 488-conjugated anti-mouse secondary antibody and Alexa Fluor 564-conjugated anti-rabbit secondary antibody were then applied. Green fluorescence indicates Udu-P/S, while red fluorescence indicates the expression of Myc-tagged proteins. Blue color is DAPI used for nuclear counterstain. Merged images show the nuclear co-localization of Udu and the interacting proteins. |
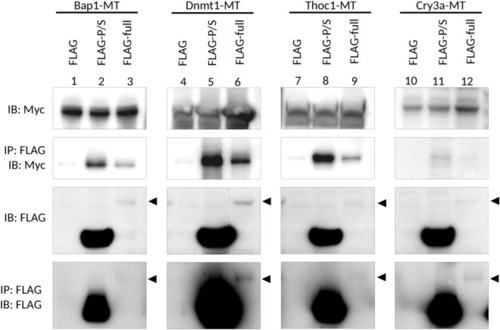
Co-immunoprecipitation analysis for the interaction of Udu with Bap1, Dnmt1, Thoc1, and Cry3a. Flag-tagged control or Flag-tagged Udu-expressing constructs were co-transfected with different Myc-tagged candidate Udu-interacting proteins, including Bap1, Dnmt1, Thoc1, and Cry3a. The cell lysate was incubated with anti-FLAG M2 magnetic beads, then subjected to immunoblot with anti-MYC or anti-FLAG antibody. Arrowheads indicate the expected size of full-length Udu. Lanes 1 to 9 were cropped from the same blots, while lanes 10–12 were from the other ones. To observe the expression of full-length Udu, photographs using a longer exposure time of anti-FLAG immunoblots were taken. The original un-cropped immunoblots were shown in Supplementary Fig. S7a and photographs with shorter exposure time for anti-FLAG immunoblots were also included in Supplementary Fig. S7b as supporting information. |
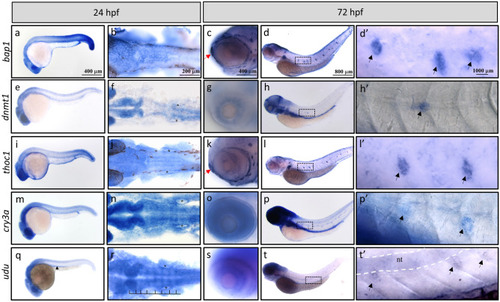
Whole mount in situ hybridization analysis for temporal and spatial expression of the EXPRESSION / LABELING:
|

ZFIN is incorporating published figure images and captions as part of an ongoing project. Figures from some publications have not yet been curated, or are not available for display because of copyright restrictions. |
|
ZFIN is incorporating published figure images and captions as part of an ongoing project. Figures from some publications have not yet been curated, or are not available for display because of copyright restrictions. EXPRESSION / LABELING:
PHENOTYPE:
|