
- Title
-
Morphometric analysis of developing zebrafish embryos allows predicting teratogenicity modes of action in higher vertebrates
- Authors
- Jarque, S., Rubio-Brotons, M., Ibarra, J., Ordoñez, V., Dyballa, S., Miñana, R., Terriente, J.
- Source
- Full text @ Reprod. Toxicol.

Fig. 1. Analysis of PCA results. (A) Loading plots for PC1, PC2 and PC3; a coefficient is assigned to each phenotype according to its representativeness in each of the three PCs. −1 means that the phenotype has low relevance for a given PC, while +1 means high relevance. The overall variation associated to each PC is indicated as percentage. (B) Pearson’s correlation matrix between the 16 teratogenic phenotypes evaluated in the study. Numbers show the degree of correlation between each pair of phenotypes. Values in green indicate positive correlation, i.e. phenotypes that manifest together. Values in red indicate negative correlation, i.e. phenotypes that manifest in opposite directions. Color intensity increases according to the degree of correlation. LE: body length; ES: eye size; PG, pigmentation; HE: heart edema; YS: yolk size; YE: yolk edema; OV: otic vesicle; OT: otoliths absence; BA: body axis; DD: developmental delay; TB: tail bending; SC: scoliosis; FA: fin absence; HA: hatching ratio; LJ: lower jaw (For interpretation of the references to color in this figure legend, the reader is referred to the web version of this article). |
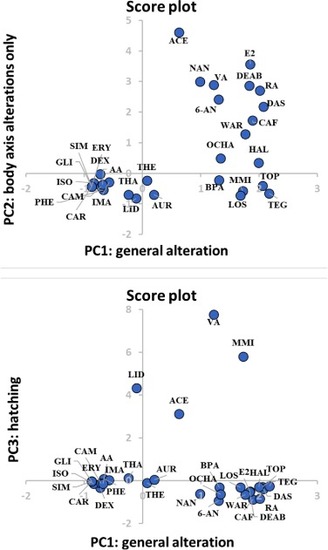
Fig. 2. Distribution of compounds according to their PC values. (A) PC1 vs PC2, (B) PC1 vs PC3. |
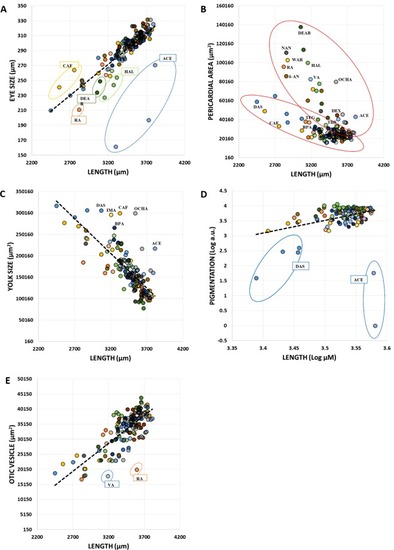
Fig. 3. Correlation between the different size-based phenotypes, and identification of compounds with potential specific mode of action. (A) Body length vs eye size, (B) body length vs heart edema, (C) body length vs yolk size, (D) body length vs pigmentation and (E) body length vs otic vesicle. Each dot represents the mean of the population for each concentration. Notice that units in (D) are expressed in logarithmic scale for better clarity. |
Reprinted from Reproductive toxicology (Elmsford, N.Y.), 96, Jarque, S., Rubio-Brotons, M., Ibarra, J., Ordoñez, V., Dyballa, S., Miñana, R., Terriente, J., Morphometric analysis of developing zebrafish embryos allows predicting teratogenicity modes of action in higher vertebrates, 337-348, Copyright (2020) with permission from Elsevier. Full text @ Reprod. Toxicol.